-
Notifications
You must be signed in to change notification settings - Fork 0
Expand file tree
/
Copy pathdirectionalData.Rmd
More file actions
554 lines (434 loc) · 15.6 KB
/
directionalData.Rmd
File metadata and controls
554 lines (434 loc) · 15.6 KB
1
2
3
4
5
6
7
8
9
10
11
12
13
14
15
16
17
18
19
20
21
22
23
24
25
26
27
28
29
30
31
32
33
34
35
36
37
38
39
40
41
42
43
44
45
46
47
48
49
50
51
52
53
54
55
56
57
58
59
60
61
62
63
64
65
66
67
68
69
70
71
72
73
74
75
76
77
78
79
80
81
82
83
84
85
86
87
88
89
90
91
92
93
94
95
96
97
98
99
100
101
102
103
104
105
106
107
108
109
110
111
112
113
114
115
116
117
118
119
120
121
122
123
124
125
126
127
128
129
130
131
132
133
134
135
136
137
138
139
140
141
142
143
144
145
146
147
148
149
150
151
152
153
154
155
156
157
158
159
160
161
162
163
164
165
166
167
168
169
170
171
172
173
174
175
176
177
178
179
180
181
182
183
184
185
186
187
188
189
190
191
192
193
194
195
196
197
198
199
200
201
202
203
204
205
206
207
208
209
210
211
212
213
214
215
216
217
218
219
220
221
222
223
224
225
226
227
228
229
230
231
232
233
234
235
236
237
238
239
240
241
242
243
244
245
246
247
248
249
250
251
252
253
254
255
256
257
258
259
260
261
262
263
264
265
266
267
268
269
270
271
272
273
274
275
276
277
278
279
280
281
282
283
284
285
286
287
288
289
290
291
292
293
294
295
296
297
298
299
300
301
302
303
304
305
306
307
308
309
310
311
312
313
314
315
316
317
318
319
320
321
322
323
324
325
326
327
328
329
330
331
332
333
334
335
336
337
338
339
340
341
342
343
344
345
346
347
348
349
350
351
352
353
354
355
356
357
358
359
360
361
362
363
364
365
366
367
368
369
370
371
372
373
374
375
376
377
378
379
380
381
382
383
384
385
386
387
388
389
390
391
392
393
394
395
396
397
398
399
400
401
402
403
404
405
406
407
408
409
410
411
412
413
414
415
416
417
418
419
420
421
422
423
424
425
426
427
428
429
430
431
432
433
434
435
436
437
438
439
440
441
442
443
444
445
446
447
448
449
450
451
452
453
454
455
456
457
458
459
460
461
462
463
464
465
466
467
468
469
470
471
472
473
474
475
476
477
478
479
480
481
482
483
484
485
486
487
488
489
490
491
492
493
494
495
496
497
498
499
500
501
502
503
504
505
506
507
508
509
510
511
512
513
514
515
516
517
518
519
520
521
522
523
524
525
526
527
528
529
530
531
532
533
534
535
536
537
538
539
540
541
542
543
544
545
546
547
548
549
550
551
552
553
Introduction
============
Examples
--------
Wish to analyze data in which response is a "direction":
- 2d directional data are called *circular* data
- 3d directional data are called *spherical* data
- not all "directional" data are directions in the usual sense
- "directional" data may also arise in higher dimensions
Wind Directions
---------------
- Recorded at Col de la Roa, Italian Alps
- n = 310 (first 40 listed below)
- Radians, clockwise from north
- Source: Agostinelli (CSDA 2007); also R package `circular`
```{r Packages, include = FALSE}
library("ascii")
library("circular")
#library("pander")
library("knitr")
library("xtable")
library("fAsianOptions")
```
### Data
```{r Data, echo = F, warning = FALSE}
data_matrix <- matrix(wind[1:40], ncol=5, byrow=TRUE)
colnames(data_matrix) <- c("(1)", "(2)", "(3)", "(4)", "(5)")
#ascii(data_matrix, digits=2,
# include.rownames=FALSE, include.colnames=FALSE)
kable(x = data_matrix, digits = 2, row.names = F, col.names = colnames(data_matrix))
```
```{r windConvert, include = F}
windc <- circular(wind, type="angles", units="radians",
template="geographics")
```
### Plot
```{r windDataPlot, echo = F}
par(mar=c(0,0,0,0)+0.1, oma=c(0,0,0,0)+0.1)
plot(windc, cex=1.5, axes=FALSE,
bin=360, stack=TRUE, sep=0.035, shrink=1.3)
axis.circular(at=circular(seq(0, (7/4)*pi, pi/4),
template="geographics"),
labels=c("N","NE","E","SE","S","SW","W","NW"),
cex=1.4)
ticks.circular(circular(seq(0, (15/8)*pi, pi/8)),
zero=pi/2, rotation="clock",
tcl=0.075)
```
Arrival Times at an ICU
-----------------------
- 24-hour clock times (format `hrs.mins`)
- n = 254 (first 32 listed below)
- Source: Cox & Lewis (1966); also Fisher (1993) and R package
`circular`
### Data
```{r Data2, echo = FALSE, warning = FALSE}
data_fisher <- matrix(fisherB1[1:32], ncol=4, byrow=TRUE)
colnames(data_fisher) <- c("(1)", "(2)", "(3)", "(4)")
#ascii(data_fisher, digits=2,
# include.rownames=FALSE, include.colnames=FALSE)
kable(data_fisher, col.names = colnames(data_fisher))
```
### Plot
``` {r icuDataPlot, echo = FALSE}
## Note that pch=17 does not work properly here.
par(mar=c(0,0,0,0)+0.1, oma=c(0,0,0,0)+0.1)
plot(fisherB1c, cex=1.5, axes=TRUE,
bin=360, stack=TRUE, sep=0.035, shrink=1.3)
```
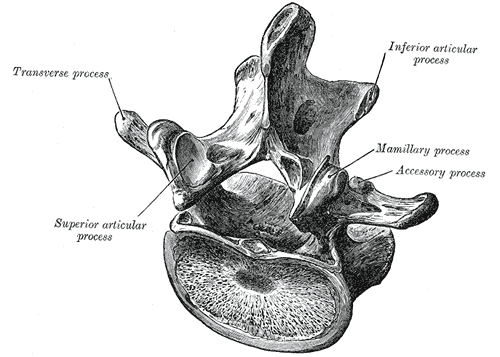
Primate Vertebrae
-----------------
- Orientation of left superior facet of last lumbar vertebra in
humans, gorillas, and chimpanzees
- Source: Keifer (2005 UF Anthropology MA Thesis)
Plot of Human Data
------------------

Butterfly Migrations
--------------------
- Direction of travel observed for 2649 migrating butterflies in
Florida
- Source: Thomas J Walker, University of Florida, Dept of Entomology
and Nematology
- Other variables:
- site: 23 locations in Florida
- observer: Thomas Walker (tw) or James J. Whitesell (jw)
- species: cloudless sulphur (cs), gulf fritillary (gf),
long-tailed skipper (lt)
- distance to coast (km)
- date and time of observation
- percentage of sky free of clouds
- quality of sunlight: (b)right, (h)aze, (o)bstructed, (p)artly
obstructed
- presence/absence and direction (N, NE, E, SE, S, SW, W, NW) of wind temperature
Why is the Analysis of Directional Data Different?
--------------------------------------------------
- First three observations from the wind directions data:
`r paste(round(wind[1:3], 2), collapse=", ")`
- The mean of these three numbers is `r round(mean(wind[1:3]), 2)`
- What do you think?
``` {r meanAnglePlot, echo = F}
par(mar=c(0,0,0,0)+0.1, oma=c(0,0,0,0)+0.1)
plot(windc[1:3], cex=2, lwd=1.5, axes=TRUE, ticks=TRUE, tcl=0.05)
points(circular(mean(wind[1:3]), units="radians", template="geographics"),
pch=8, cex=4)
```
Graphical Display of Directional Data
=====================================
Graphical Display of Circular Data (in R)
-----------------------------------------
- Have already seen simple dot plots for circular data, e.g., for the
wind data:
``` {r, echo = F, warning = NA}
<<windConvert>>
<<windDataPlot>>
```
Graphical Display of Circular Data (in R) (ctd)
-----------------------------------------------
- and for the ICU data:
``` {r, echo = F, warning = NA}
<<icuDataPlot>>
```
- and one more ...
Graphical Display of Circular Data (in R) (ctd)
-----------------------------------------------
``` {r antsDataPlot, echo = F, wwarning = F}
par(mar=c(0,0,0,0)+0.1, oma=c(0,0,0,0)+0.1)
plot(fisherB10c$set1, units="degrees", zero=pi/2,
rotation="clock", pch=16, cex=1.5)
ticks.circular(circular(seq(0, (11/6)*pi, pi/6)),
zero=pi/2, rotation="clock", tcl=0.075)
points(fisherB10c$set2, zero=pi/2,
rotation="clock", pch=16, col="darkgrey",
next.points=-0.1, cex=1.5)
points(fisherB10c$set3, zero=pi/2,
rotation="clock", pch=1,
next.points=0.1, cex=1.5)
```
Graphical Display of Circular Data (in R) (ctd)
-----------------------------------------------
``` {r , eval = F}
<<antsDataPlot>>
```
Circular Histograms
-------------------
- [Circular
histograms](https://www.google.com/search?q=R+circular+histogram)
exist (see Fisher and Mardia and Jupp) but is there a ready-made
function in R?
Rose Diagrams
-------------
- Invented by [Florence
Nightingale](https://en.wikipedia.org/wiki/Florence_Nightingale)
(elected first female member of the Royals Statistical Society in
1859; honorary member of ASA)
- [Nightingale's rose in
R](https://github.com/jennybc/r-graph-catalog/tree/master/figures/fig05-14_nightingale-data)
(see also [this
post](http://www.r-bloggers.com/going-beyond-florence-nightingales-data-diagram-did-flo-blow-it-with-wedges/)
and the [R graph
catalog](http://shiny.stat.ubc.ca/r-graph-catalog/))
- Note that radii of segments are proportional to *square root* of the
frequencies (counts), so that areas are proportional to frequencies.
Is this the right thing to do?
- Rose diagrams suffer from the same problems as histograms. The
impression conveyed may depend strongly on:
- the binwidth of the cells
- the choice of starting point for the bins
Adding a Rose Diagram to the Plot of Wind Directions
----------------------------------------------------
``` {r windRosePart, eval = F}
rose.diag(windc, bins=16, col="darkgrey",
cex=1.5, prop=1.35, add=TRUE)
```
Adding a Rose Diagram to the Plot of Wind Directions
----------------------------------------------------
``` {r windRose, echo = F}
<<windDataPlot>>
<<windRosePart>>
```
Changing the Binwidth
---------------------
```{r windRoseWideBinsPart, eval = F}
rose.diag(windc, bins=8, col="darkgrey",
cex=1.5, prop=1.15, add=TRUE)
```
```{r windRoseNarrowBinsPart, eval = F}
rose.diag(windc, bins=32, col="darkgrey",
cex=1.5, prop=1.7, add=TRUE)
```
### Fewer/Wider Bins
``` {r windRoseWideBins, echo = F}
<<windDataPlot>>
<<windRoseWideBinsPart>>
```
### Narrow Bins
``` {r windRoseNarrowBins, echo = F}
<<windDataPlot>>
<<windRoseNarrowBinsPart>>
```
Changing the Radii
------------------
- I think that the default "radii proportional to counts" is generally
best, but this is not always obvious. The scale certainly makes a
big difference however.
``` {r, echo = F}
<<windDataPlot>>
rose.diag(windc, bins=16, col="darkgrey",
radii.scale="linear",
cex=1.5, prop=2.4, add=TRUE)
```
Changing the Radii
------------------
``` {r windRoseLinear, echo = F}
<<windDataPlot>>
<<windRoseLinearPart>>
```
Kernel Density Estimates
------------------------
``` {r windKdensPart , eval = F}
lines(density.circular(windc, bw=40), lwd=2, lty=1)
```
Kernel Density Estimates
------------------------
``` {r windKdens, echo = F}
par(mar=c(0,0,0,0)+0.1, oma=c(0,0,0,0)+0.1)
plot(windc, cex=1.5, axes=FALSE,
bin=360, stack=TRUE, sep=0.035, shrink=1.7)
axis.circular(at=circular(seq(0, (7/4)*pi, pi/4),
template="geographics"),
labels=c("N","NE","E","SE","S","SW","W","NW"),
cex=1.4)
ticks.circular(circular(seq(0, (15/8)*pi, pi/8)),
## zero=pi/2, rotation="clock",
tcl=0.075)
<<windRosePart>>
<<windKdensPart>>
```
Spherical Data
--------------
- Are there any canned routines for plotting spherical data in R?
Basic Summary Statistics
========================
Mean Direction and Mean Resultant Length
----------------------------------------
- First three observations from the wind directions data:
```{r, echo = F, warning = F}
theta <- wind[1:3]
x <- sin(theta)
y <- cos(theta)
kable(cbind(theta, x, y), digits=2,
row.names=FALSE, col.names=c(expression(theta), "x", "y"))
```
```{r, include = F}
xsum <- sum(x); ysum <- sum(y)
xbar <- mean(x); ybar <- mean(y)
resultant <- c(xsum, ysum)
resultantLength <- sqrt(sum(resultant^2))
meanResultant <- c(xbar, ybar)
meanResultantLength <- sqrt(sum(meanResultant^2))
meanDirection <- meanResultant/meanResultantLength
meanDirectionRadians <- atan2(meanDirection[1], meanDirection[2])
```
- resultant (sum of direction vectors): (`r round(xsum, 3)`, `r round(ysum, 3)`)
- mean vector: $(\bar{x}, \bar{y}) =$ (`r round(xbar, 3)`, `r round(ybar, 3)`)
- resultant length (Euclidean norm of resultant): $R =$
`r round(resultantLength, 3)`
- mean resultant length: $\bar{R} =$
`r round(meanResultantLength, 3)`
- mean direction: $(\bar{x}, \bar{y})/\bar{R} =$
(`r round(meanDirection[1], 3)`, `r round(meanDirection[2], 3)`)
- $\tilde{\theta} =$ `r round(meanDirectionRadians, 3)`
Plot
----
``` {r meanDirection, echo = F}
par(mar=c(0,0,0,0)+0.1, oma=c(0,0,0,0)+0.1)
plot(windc[1:3], cex=2, lwd=1.5, axes=TRUE, ticks=TRUE, tcl=0.05)
points(circular(meanDirectionRadians, units="radians", template="geographics"),
pch=8, cex=4)
```
Aside: Generating from the Uniform Distribution on the Sphere
=============================================================
Generating Random Points on the Sphere
--------------------------------------
- Wish to generate a random "direction" in d-dimensions; i.e., an
observation from the uniform distribution in the $d-1$ sphere.
- Usual way: let $X \sim N_d(0, I)$ and return $U = X/||X||$.
- An alternative rejection sampler:
- Repeat until $||X|| \leq 1$
- Let $X$ be uniformly distributed on the cube $[-1,1]^d$
- Return $U = X/||X||$
- What is the acceptance rate for the rejection sampler:
- Volume of the $d - 1$ sphere is $\pi^{d/2}/\Gamma(d/2 + 1)$
- Volume of $[-1,1]^d$ is $2^d$
- Acceptance rate is $(\pi^{1/2}/2)^d/\Gamma(d/2 + 1)$
- Curse of dimensionality
```{r, warning = F, echo = F}
accRate <- function(d) ((sqrt(pi)/2)^d)/gamma(d/2 + 1)
d <- 2:10
## ar <- matrix(accRate(d), nrow=1,
## dimnames=list("accept rate", "d"=d))
ar <- cbind("dimension"=d, "accept rate (%)"= 100*accRate(d))
kable(ar, digits=0, row.names=F)
```
Code for Timing Results
-----------------------
``` {r runifSphereR, eval = F}
runifSphere <- function(n, dimension, method=c("norm", "cube", "slownorm")) {
method <- match.arg(method)
if (method=="norm") {
u <- matrix(rnorm(n*dimension), ncol=dimension)
u <- sweep(u, 1, sqrt(apply(u*u, 1, sum)), "/")
} else if (method=="slownorm") {
u <- matrix(nrow=n, ncol=dimension)
for (i in 1:n) {
x <- rnorm(dimension)
xnorm <- sqrt(sum(x^2))
u[i,] <- x/xnorm
}
} else {
u <- matrix(nrow=n, ncol=dimension)
for (i in 1:n) {
x <- runif(dimension, -1, 1)
xnorm <- sqrt(sum(x^2))
while (xnorm > 1) {
x <- runif(dimension, -1, 1)
xnorm <- sqrt(sum(x^2))
}
u[i,] <- x/xnorm
}
}
u
}
```
Easy fix for Borel's paradox in 3-d
-----------------------------------
Take longitude $\phi \sim U(0,2\pi)$ independent of latitude
$\theta = \arcsin(2U-1)$, $U \sim U(0,1)$.
Rotationally Symmetric Distributions
====================================
Comparison of Projected Normal and Langevin Distributions
---------------------------------------------------------
One way that we might compare the $\text{langevin}(\mu, \kappa)$ and
$\text{PN}(\gamma\mu, I)$ distributions by choosing $\kappa$ and $\gamma$ to give the
same mean resultant lengths and comparing the densities of the cosine of
the angle $\theta$ between $U$ and $\mu$.
Of course matching mean resultant lengths is not necessarily the best
way to compare these families of distributions.
```{r, echo = F, include = F}
mrlPN <- function(gamma, dimen) {
require(fAsianOptions)
zeta <- (gamma * gamma) / 2
hdp1 <- dimen/2 + 0.5
hdp2 <- hdp1 + 0.5
gamma * exp(-zeta + lgamma(hdp1) - lgamma(hdp2)) *
Re(kummerM(zeta, hdp1, hdp2)) / sqrt(2)
}
imrlPN <- function(mrl, dimen, lower = 1e-5, upper = 18) {
uniroot(function(x) mrlPN(x, dimen) - mrl, c(lower, upper))$root
}
mrlLvMF <-
function(kappa, dimen) besselI(kappa, dimen/2) / besselI(kappa, dimen/2 - 1)
imrlLvMF <- function(mrl, dimen, lower = 1e-5, upper = 700) {
uniroot(function(x) mrlLvMF(x, dimen) - mrl, c(lower, upper))$root
}
dPNAngle <- function(theta, gamma, dimen) {
### gamma = length (norm) of eta in PN(eta, I) distribution.
ct <- cos(theta)
st <- sin(theta)
dnorm(gamma * st) * iternorm(gamma * ct, dimen - 1) * st^(dimen - 2) *
2^(dimen/2) * (dimen - 1) * gamma(dimen/2)
}
iternorm <- function(x, k) {
###
### Computes the kth iterated integral of the normal distribution
### function.
###
k <- as.integer(k)
if (k < 1) stop("k must be a positive integer (k >= 1)")
a <- dnorm(x)
b <- pnorm(x)
c <- a + x * b
if (k > 1) {
for (i in 2:k) {
a <- b
b <- c
c <- (a + x * b) / i
}
}
c
}
dLvMFAngle <- function(theta, kappa, dimen) {
exp(kappa * cos(theta)) * (sin(theta))^(dimen - 2) *
(kappa^(dimen/2 - 1) /
(besselI(kappa, dimen/2 - 1) *
2^(dimen/2 - 1) * sqrt(pi) * gamma(dimen/2 - 0.5)))
}
plotPNvLvMF <- function(dimen, lwd=0.75) {
rho <- c(0.10,0.25,0.50,0.75,0.90,0.95)
theta <- seq(0, pi, length = 201)
mulen <- sapply(rho, imrlPN, dimen = dimen)
kappa <- sapply(rho, imrlLvMF, dimen = dimen)
ypn <- outer(theta, mulen, FUN = "dPNAngle", dimen = dimen)
yfvm <- outer(theta, kappa, FUN = "dLvMFAngle", dimen = dimen)
lty0 <- rep(c(1,2), each = length(rho))
matplot(theta, cbind(ypn, yfvm), type = "l",
lty = lty0, lwd = lwd, col = 1,
xaxt = "n", xlab = "", ylab = "")
legend("topright", legend = c("PN", "Langevin"), lty = 1:2)
axis(1, at = pi * (0:4)/4,
## labels = expression(0, , pi/2, , pi))
labels = expression(0, pi/4, pi/2, 3*pi/4, pi))
}
```
$d = 2$
-------
``` {r PNvLvMF2, echo = F}
par(mar=c(2,2,0,0)+0.1, oma=c(0,0,0,0)+0.1)
plotPNvLvMF(2)
```
$d = 3$
-------
``` {r PNvLvMF3, echo = F}
par(mar=c(2,2,0,0)+0.1, oma=c(0,0,0,0)+0.1)
plotPNvLvMF(3)
```
$d = 4$
-------
``` {r PNvLvMF4, echo = F}
par(mar=c(2,2,0,0)+0.1, oma=c(0,0,0,0)+0.1)
plotPNvLvMF(4)
```