At night, on the surface of our planet, multiple sources of illumination, such as streetlights, buildings and ships can be seen from space. These nighttime lights are a reliable proxy for measuring the scope and intensity of human activity. Nighttime lights can be applied across a wide range of studies, from analyzing trends in urbanization — such as tracking urban expansion, or estimating population distribution.
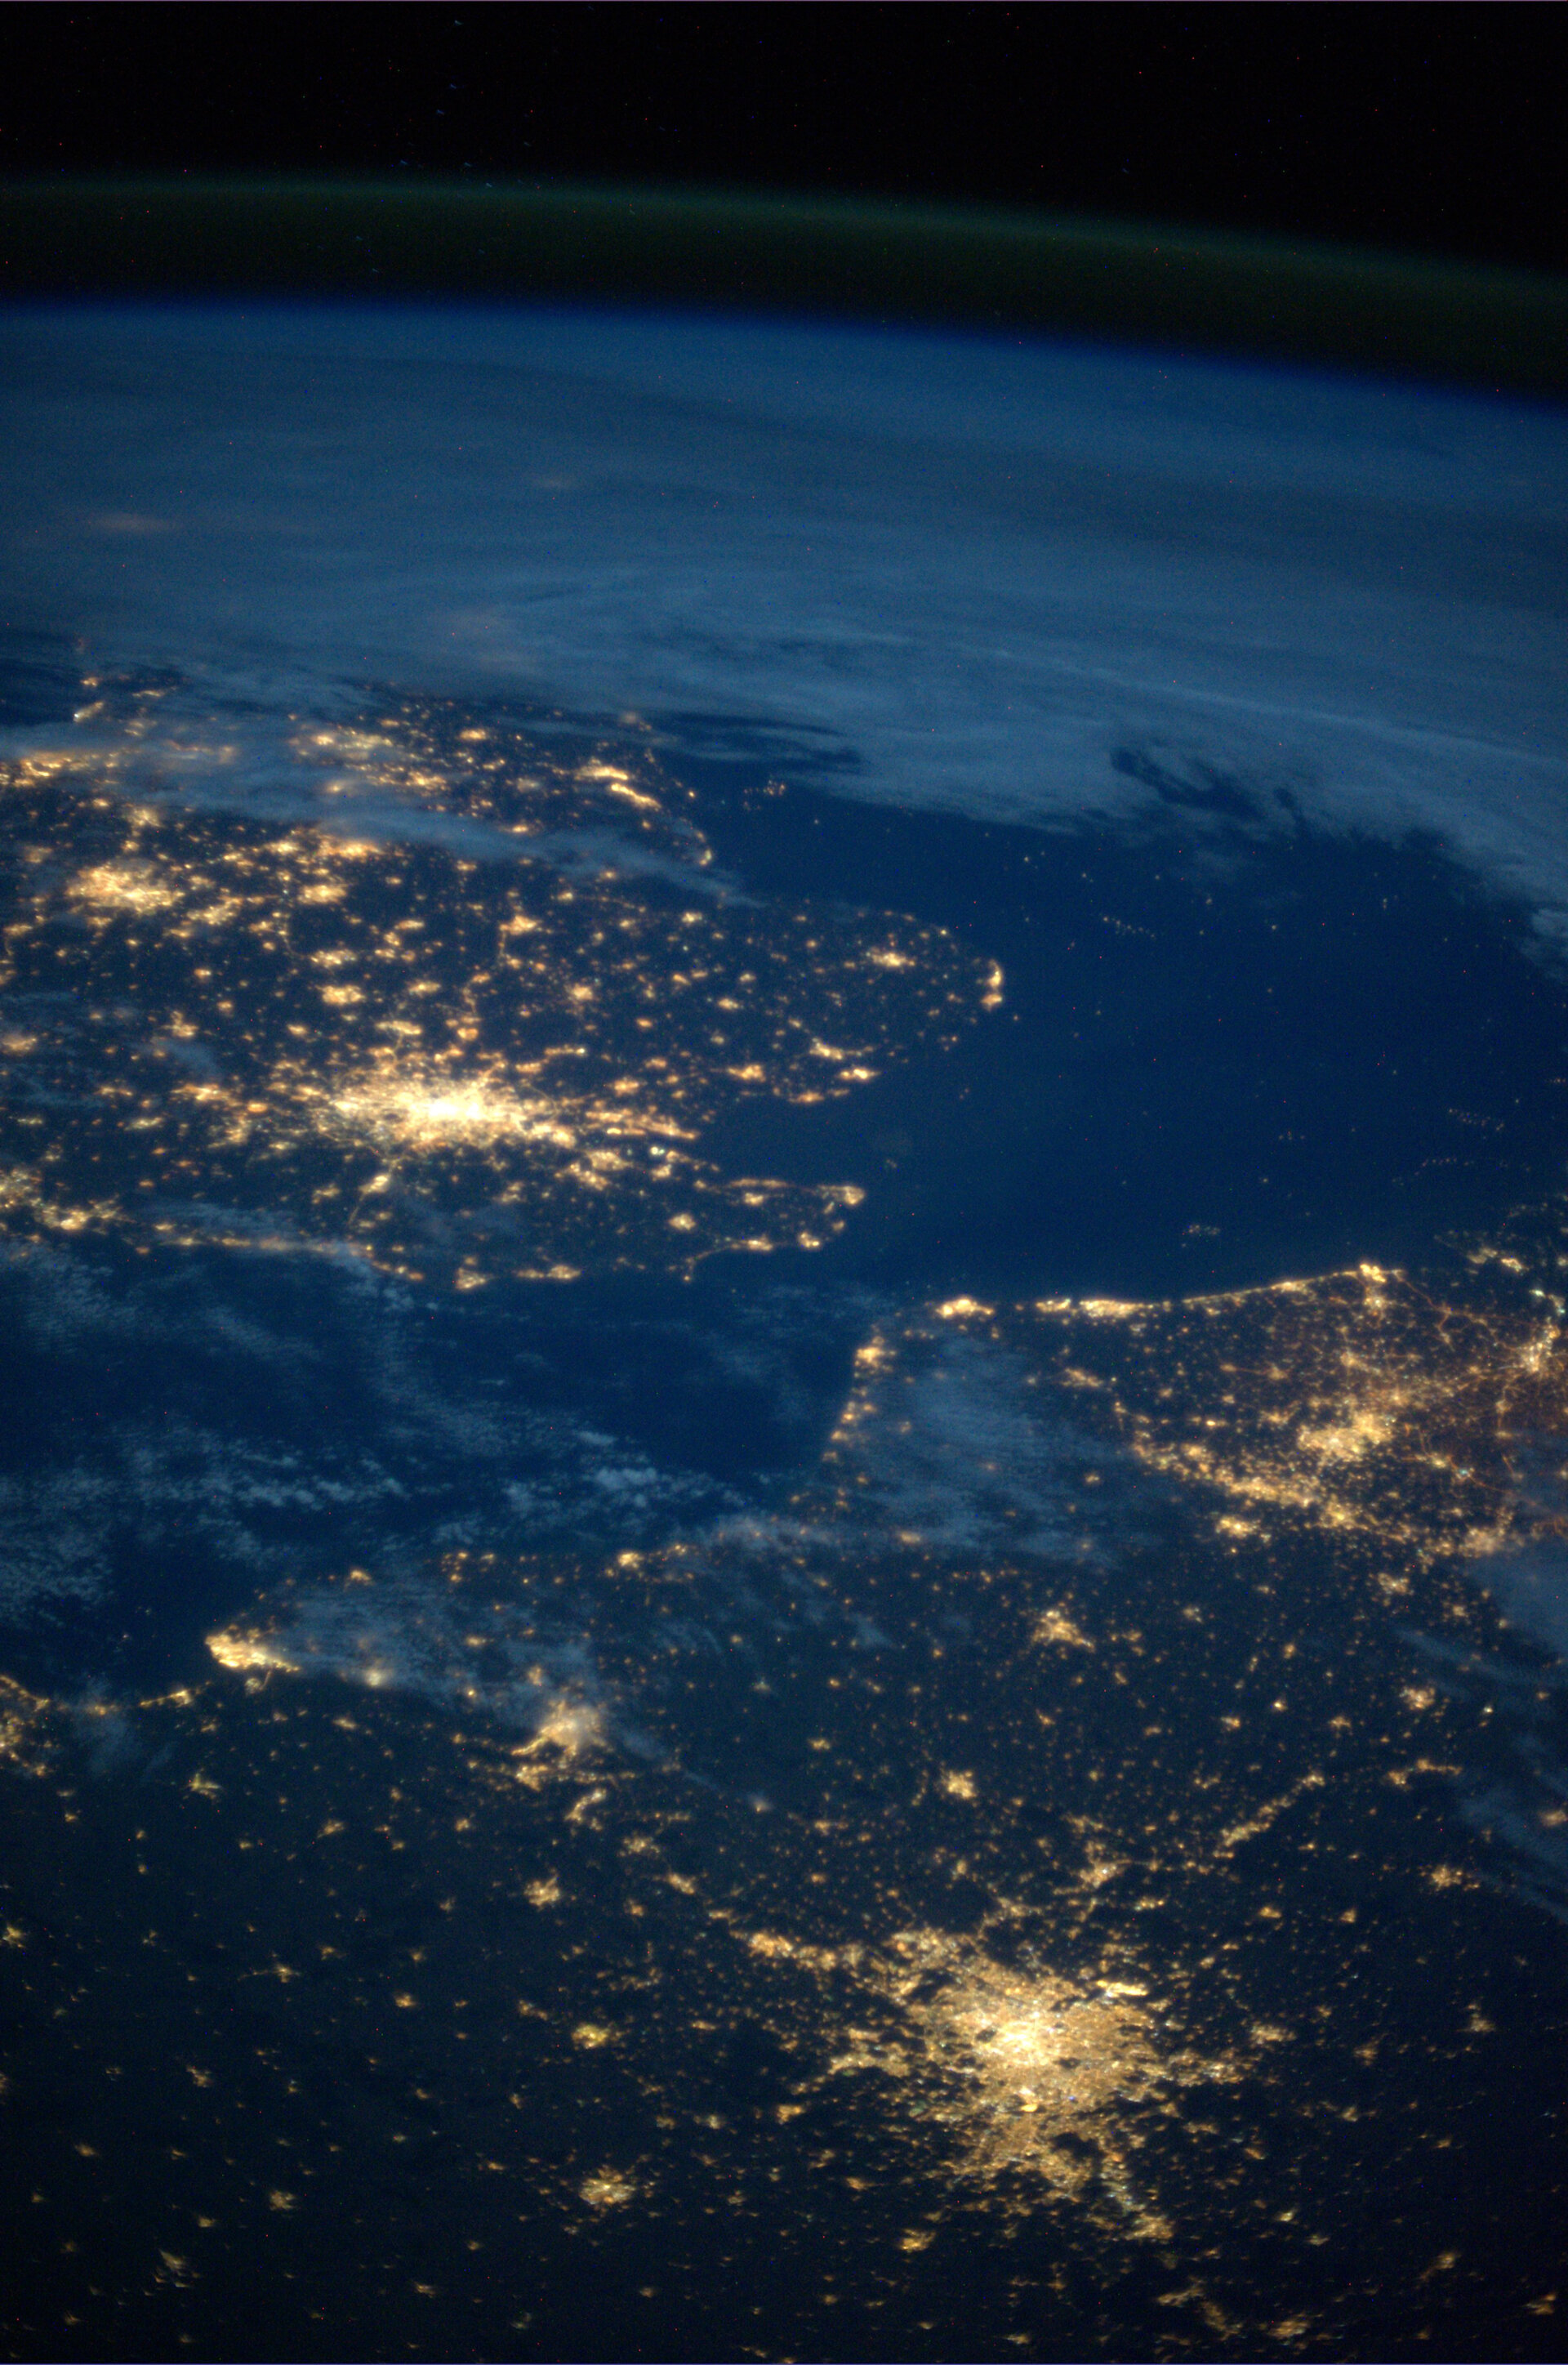
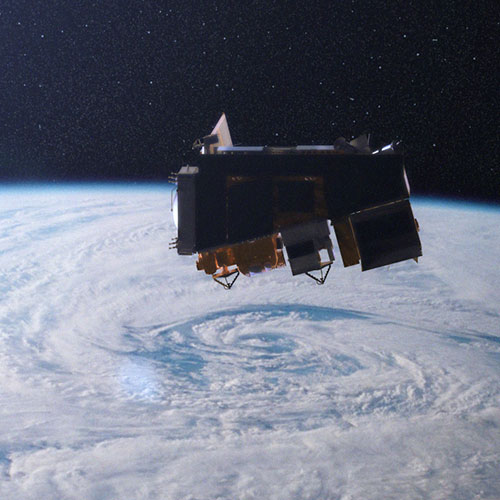
One source of nighttime light imagery is the Visible Infrared Imaging Radiometer Suite (VIIRS) aboard the Suomi National Polar-orbiting Partnership (Suomi NPP), a joint mission of the National Oceanic and Atmospheric Administration (NOAA) and NASA. This satellite makes global daily measurements of nocturnal visible and near-infrared (NIR) light that can be used for Earth system science and applications, allowing to observe signals such as city lights, gas flares, fishing vessels, aurora, gravity waves and wildfires.
This dataset is valuable for studying the distribution of artificial lighting in urban regions, offering insights into urban growth, infrastructure development, and socio-economic activity.
This dataset metrics, are 'nighttime radiance values' (measured in nanowatts per square centimeter per steradian, nW/cm²/sr), which represent the brightness of artificial lighting in urban areas. From this, the Nighttime Light Intensity (NTLI) can be generated, a composite of observations reflecting the overall intensity of visible nighttime lights in urban landscapes.

To further promote Open Science we can also share here the notebook (which reproduces the method developed by Professor Tojo allowing to visualize urban expansion and infrastrucutre development using additive color blending - i.e. assigning different years to RGB channels to reveal where artificial areas increased (which could be linked to economic growth) or decreased (suggesting reduced activity).

Access the notebook to analyze trends, and uncover patterns of human activity on a location of your choice.