Title: Multi-organ single-cell transcriptomics of immune cells uncovered organ-specific gene expression and functions
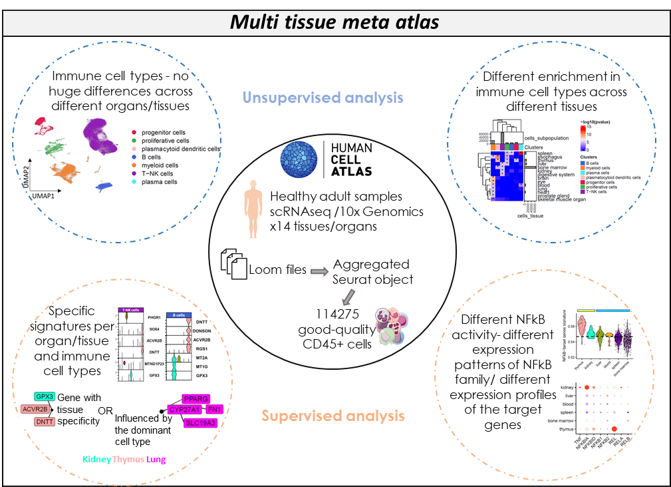
Despite the large number of publicly available single-cell datasets, there is a limited understanding of the distinct resident immune cells and their concomitant features in diverse human organs. To address this, we compiled a dataset of 114,275 CD45+ immune cells from 14 organs from healthy donors. Although the transcriptome of immune cells is constant across organs, organ-specific gene expression changes were detected revealing unique expression in certain organs (GTPX3 in kidney, DNTT and ACVR2B in thymus). These alterations are associated with different transcriptional factor activities and pathways including metabolism. TNF-α signaling through the NFkB pathway was found in various organs and immune compartments including distinct expression profiles of NFkB family genes and their target genes such as cytokines indicating their role in cell positioning. Taken together, immune cells not only protect the organs but also adapt to the host organ environment and contribute to its function and homeostasis.
The data has been deposited in different levels of organization, from raw to processed data:
- raw data. All the fastq files have been downloaded from HCA. Full table with the information regarding the used project is available in the metadata file or the supplementary table 1 of the published paper
- matrix. The counts table has been deposited in Zenodo
The packages needed to be installed, in order to run the project are:
install.packages(c("msigdbr", "data.table", "ggpubr", "tidyverse", "ggplot2", "readr", "harmony", "Seurat"))
BiocManager::install(c("clusterProfiler", "fgsea", "org.Hs.eg.db", "enrichplot", "loomR", "lisi"))
Loom2seurat_merged.R: Script to upload the loom files downloading from HCA, transformed into Seurat object, subsetting by CD45+ marker and merge the individual files in a Seurat matrix
Quality control: Folder including the script for QC metrics to identify low-quality cells based on their expression profiles and the script for calculating the lisi scoremain analysis: Folder including scripts and visualization of the main figures of the manuscript: hypergeometricdistribution.R, Correlation matrix.R, Signatures.RGSEA: Folder including the script and the results in regards to Gene Set Enrichment Analysis (GSEA)