


![]()
![]()
Operating System: 🖥️ Cross-Platform
This package supports Windows, Linux, and macOS. However, it has been primarily developed and tested on Windows.
Note: While the package can be installed on different platforms, some Windows-specific features may not work on other operating systems.
To install the Skyborn package, you can use pip:
pip install skybornor
pip install -U --index-url https://pypi.org/simple/ skybornFull documentation is available at: Documentation
Skyborn provides ultra-fast spatial trend calculation and climate index regression analysis for atmospheric data:
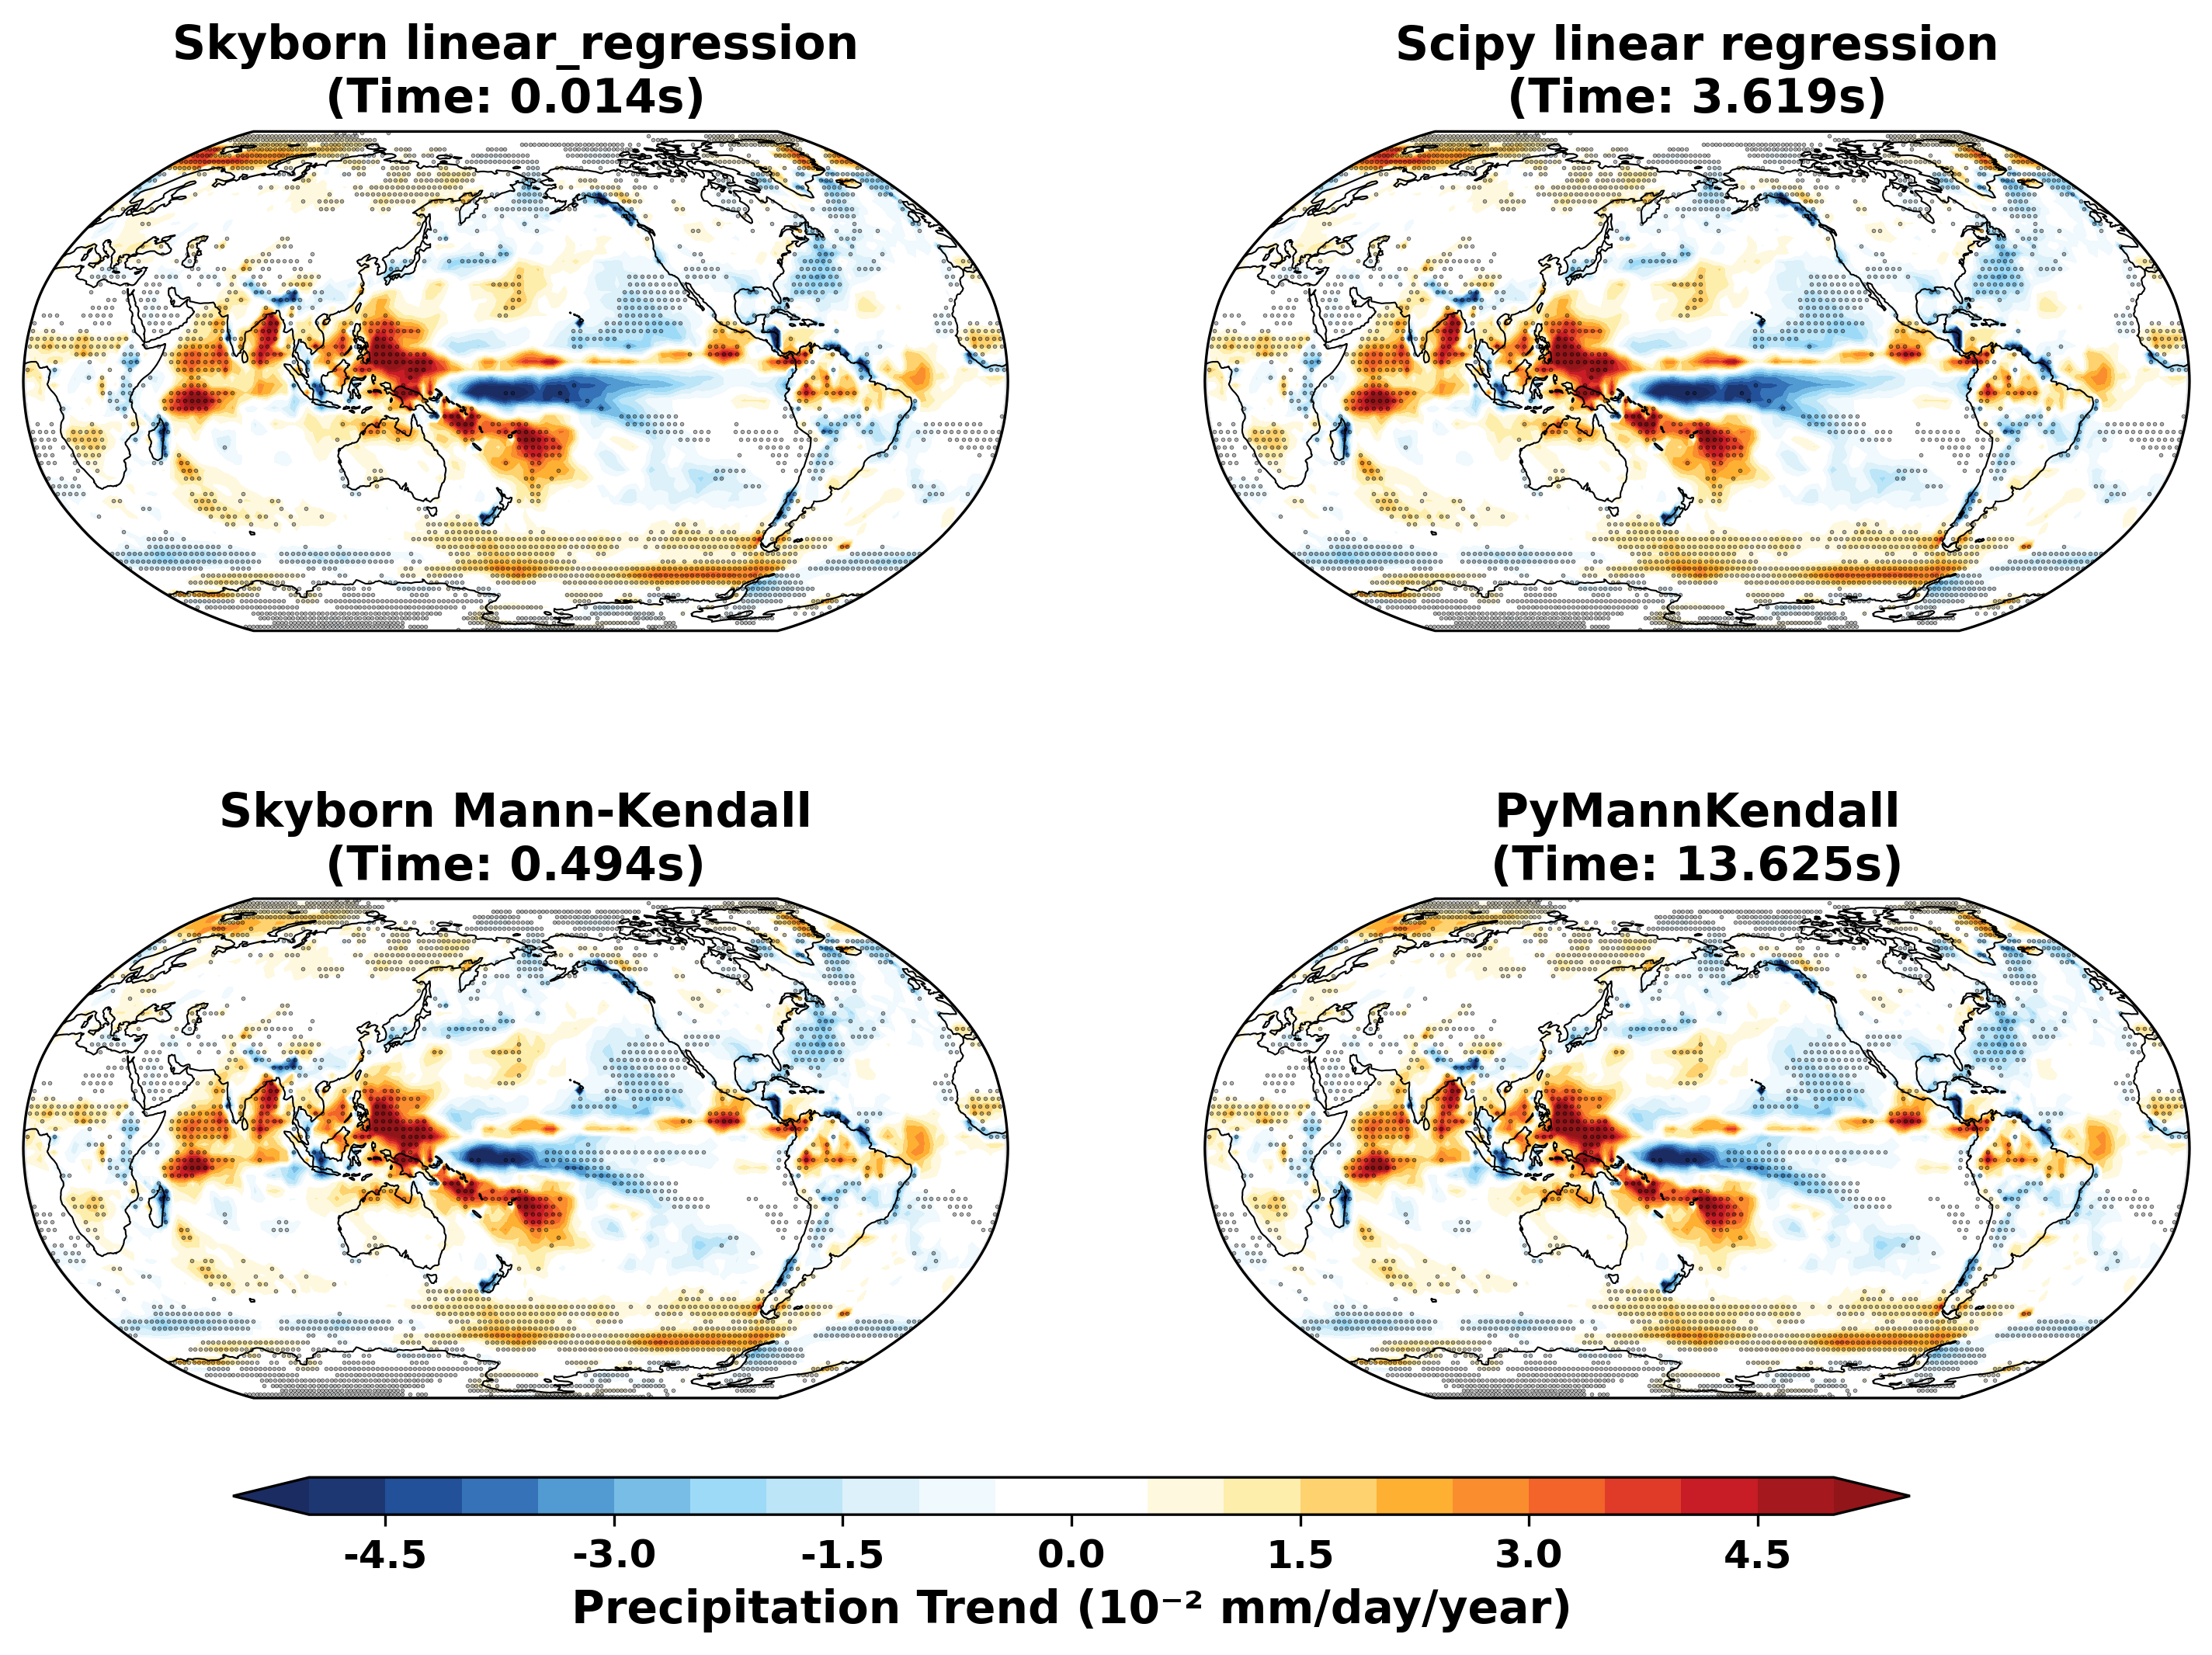
Key Capabilities:
-
High-Speed Spatial Trends: Calculate long-term climate trends across global grids
- Linear trend analysis for temperature, precipitation, and other variables
- Statistical significance testing
- Vectorized operations for massive datasets
-
Climate Index Regression: Rapid correlation and regression analysis with climate indices
- NINO 3.4, PDO, NAO, AMO index integration
- Pattern correlation analysis
- Teleconnection mapping
Other Applications:
- Climate change signal detection
- Decadal variability analysis
- Teleconnection pattern identification
- Regional climate impact assessment
The Skyborn windspharm submodule provides powerful tools for analyzing global wind patterns through streamfunction and velocity potential calculations:
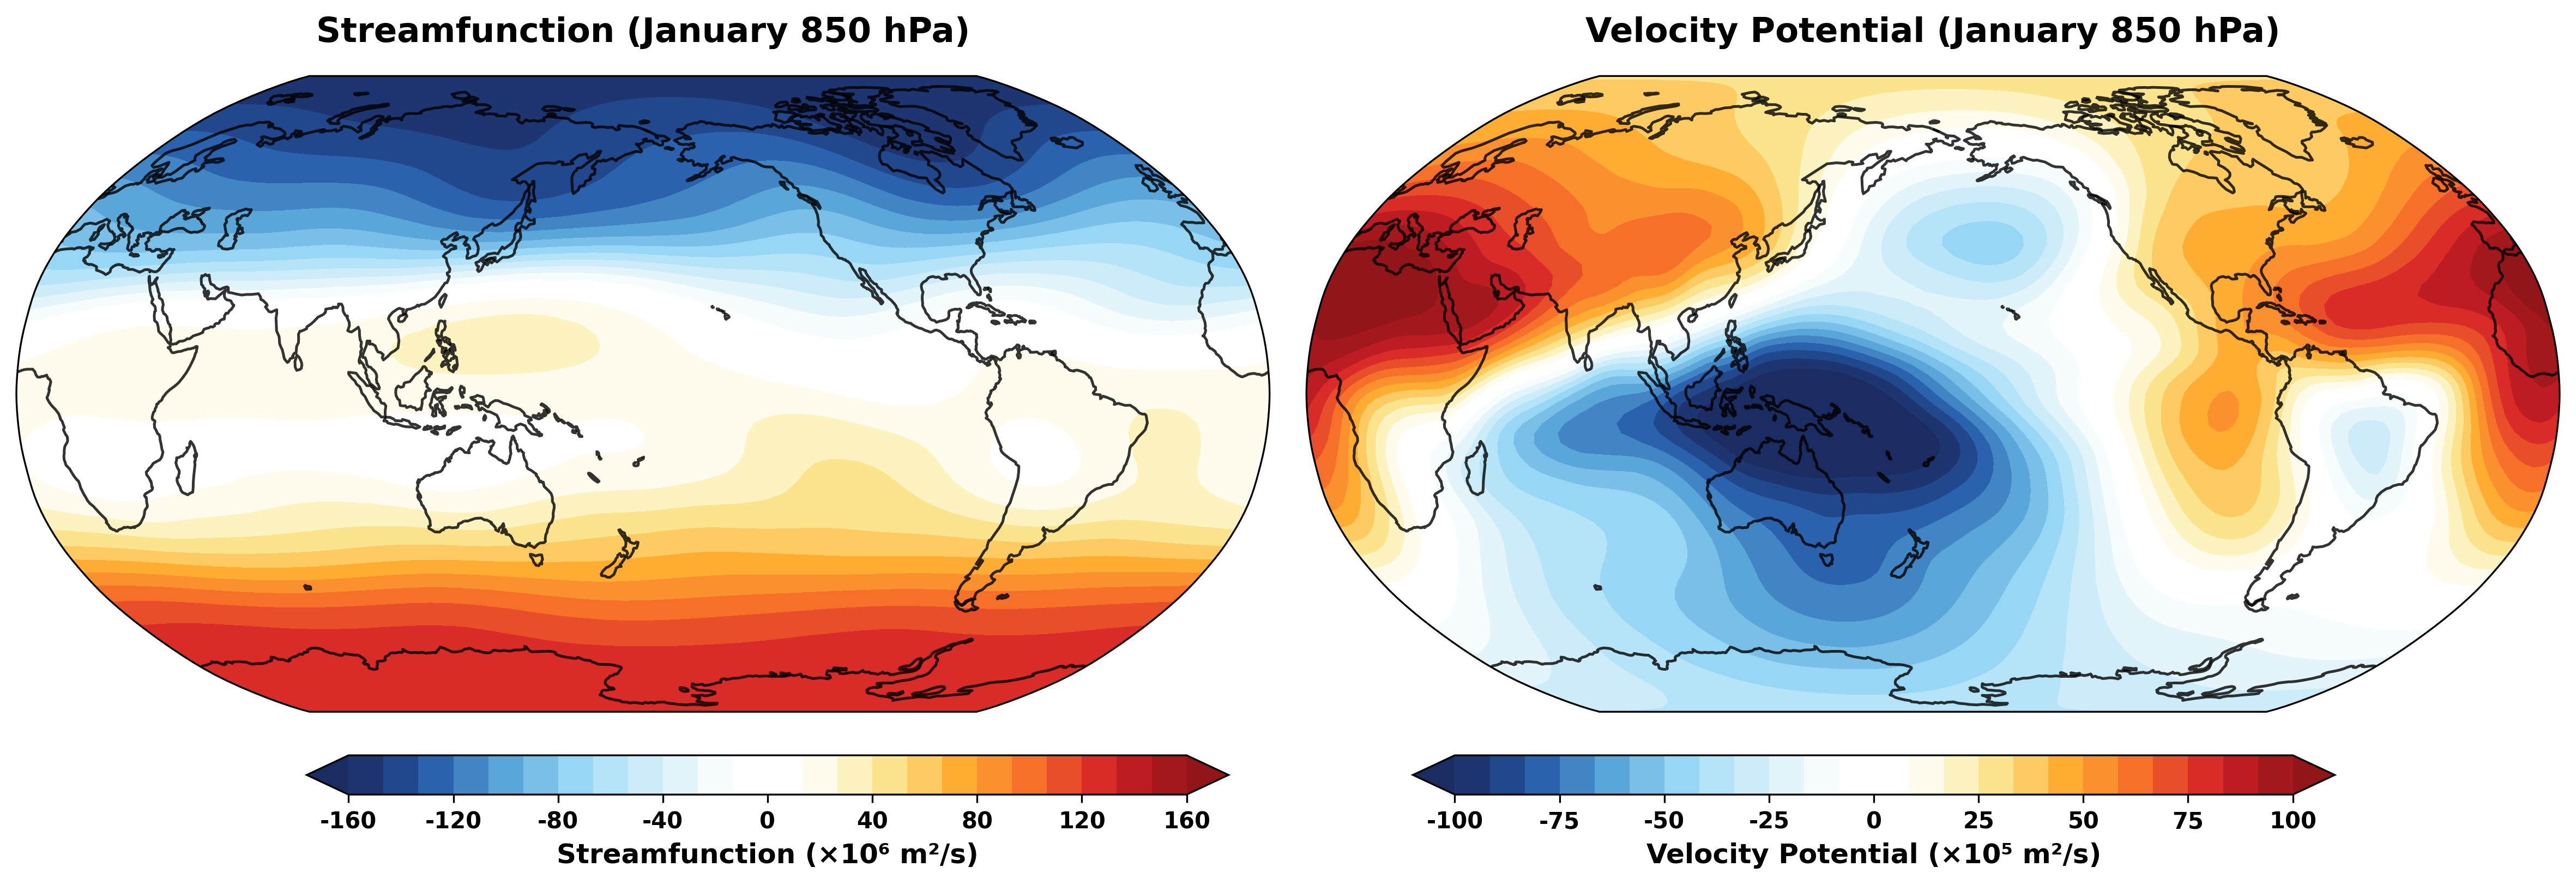
Key Capabilities:
-
Streamfunction Analysis: Identifies rotational (non-divergent) wind components
- Visualizes atmospheric circulation patterns
- Reveals jet streams and vortices
- Essential for understanding weather systems
-
Velocity Potential Analysis: Captures divergent wind components
- Shows areas of convergence and divergence
- Critical for tropical meteorology
- Identifies monsoon circulation patterns
Applications:
- Climate dynamics research
- Weather pattern analysis
- Atmospheric wave propagation studies
- Tropical cyclone formation analysis
The Skyborn gridfill submodule provides advanced interpolation techniques for filling missing data in atmospheric and climate datasets:
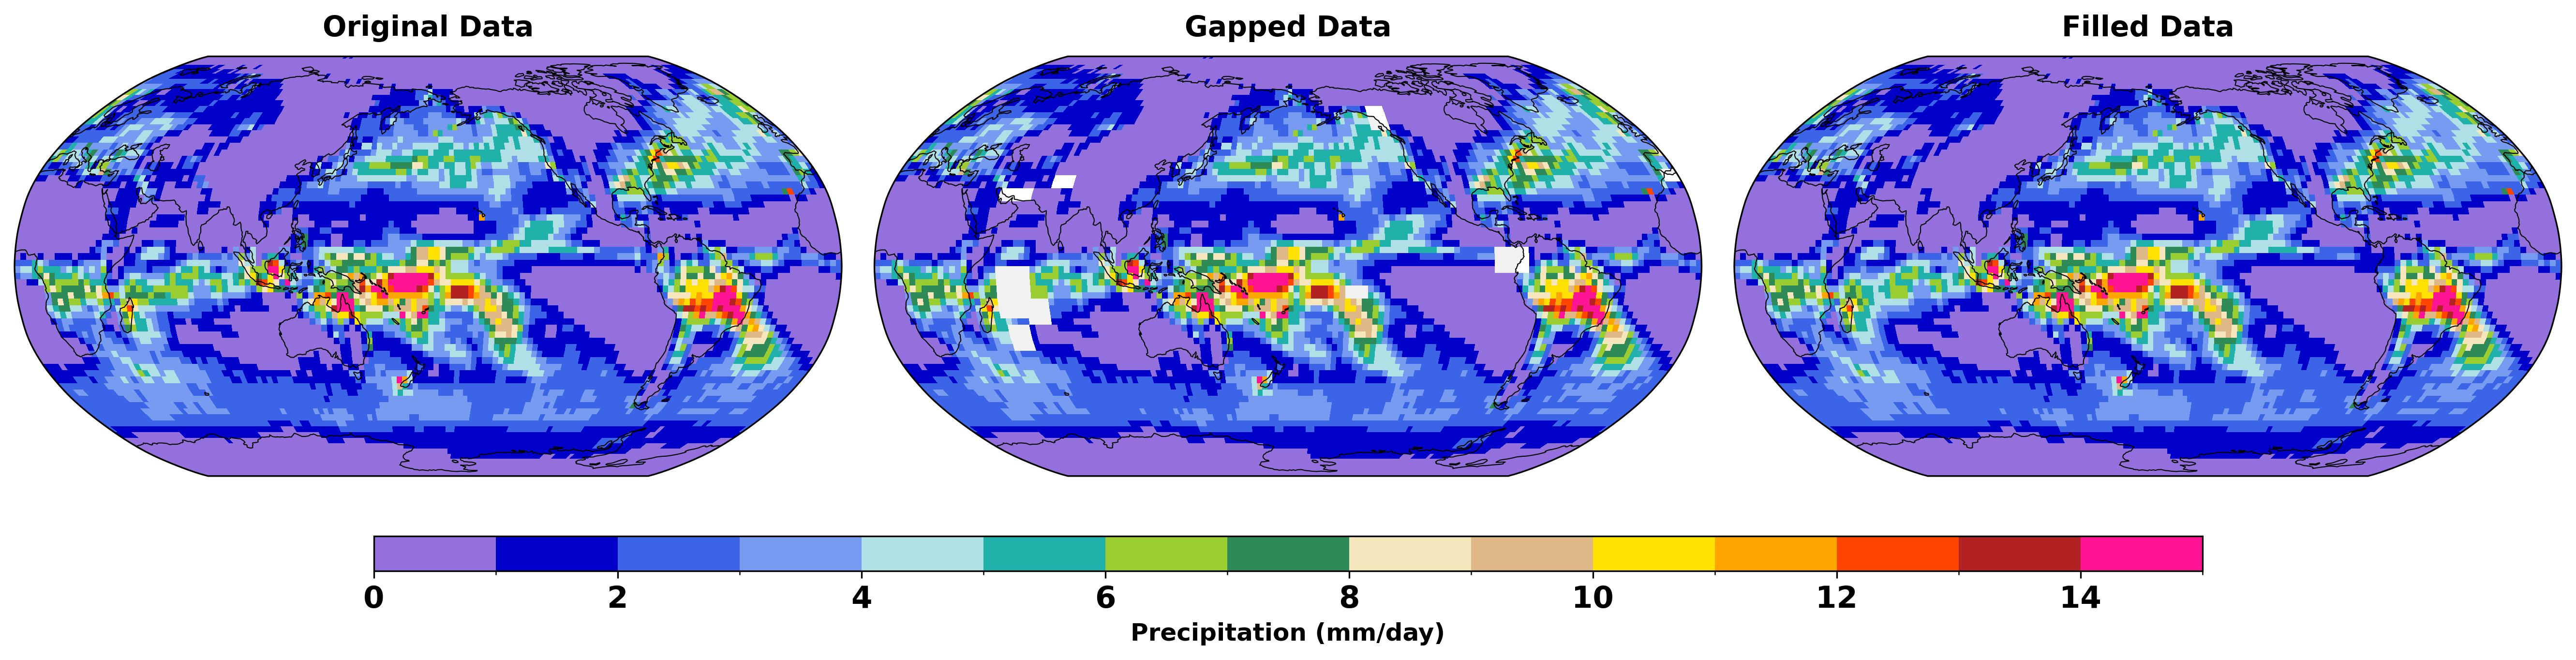
Key Features:
- Poisson-based Interpolation: Physically consistent gap filling
- Preserves Data Patterns: Maintains spatial correlations and gradients
- Multiple Methods Available:
- Basic Poisson solver
- High-precision iterative refinement
- Zonal initialization options
- Relaxation parameter tuning
Applications:
- Satellite data gap filling
- Model output post-processing
- Climate data reanalysis
- Quality control for observational datasets
The example above demonstrates filling gaps in global precipitation data, where the algorithm successfully reconstructs missing values while preserving the underlying meteorological patterns.
Skyborn provides an NCL-like curly_vector renderer for atmospheric wind fields while keeping a Matplotlib and Cartopy compatible API.
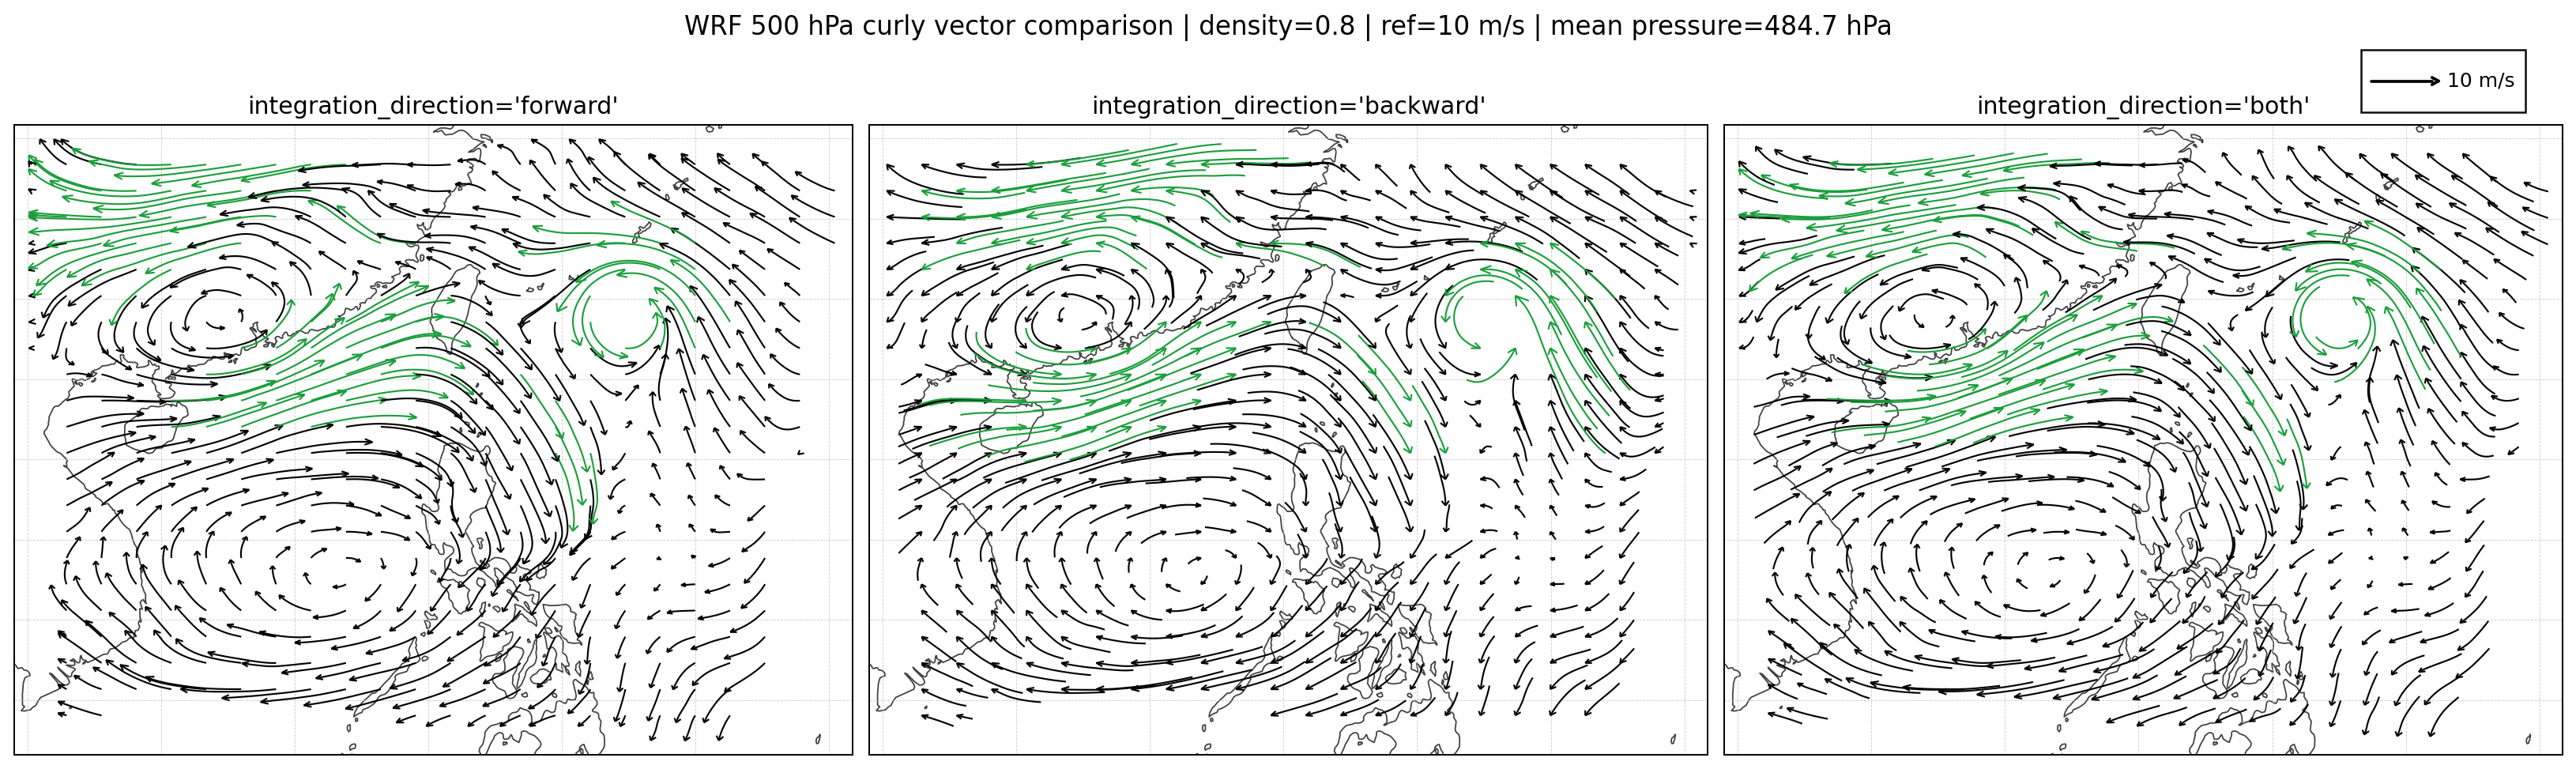
Key Capabilities:
- NCL-like Curved Vectors: Curved tails and lighter arrow heads for cleaner large-scale flow visualization
- Matplotlib-Compatible API: Works with standard axes and Cartopy projections without switching to a separate plotting stack
- Flexible Inputs: Supports regular lat-lon grids, xarray datasets, and curvilinear grids such as WRF mass-grid wind fields
- Vertical Cross-Section Support: Supports latitude-pressure and similar vertical profile plots through the same
curly_vectorAPI - Projection-Aware Rendering: Supports global rendering with different
central_longitudesettings and Cartopy projections
Skyborn curly_vector also supports vertical cross-section rendering, for example latitude-pressure plots using meridional wind and scaled omega:
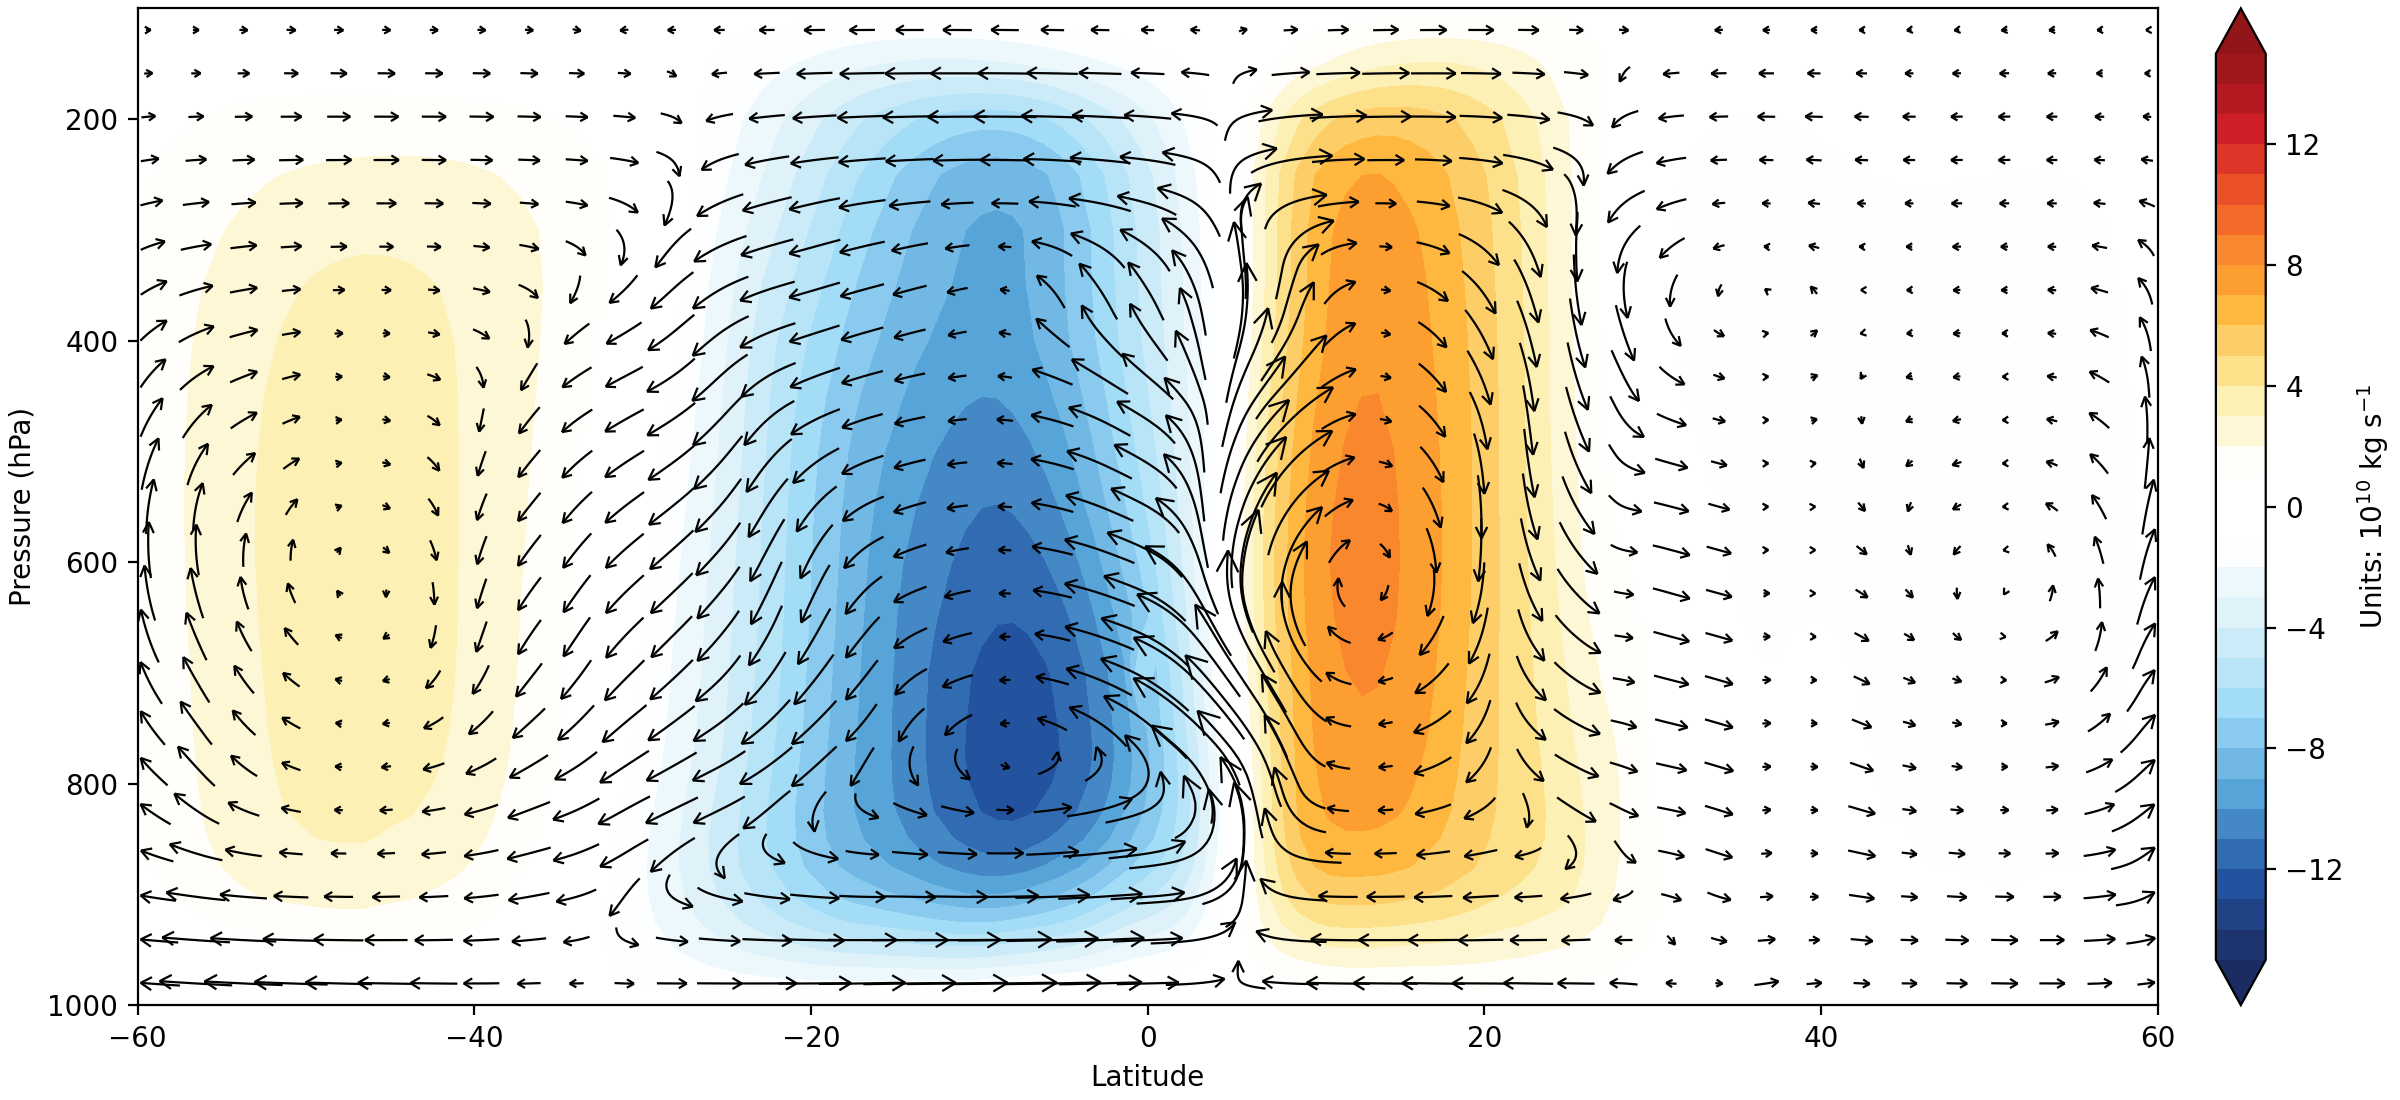
Minimal Example:
import cartopy.crs as ccrs
import matplotlib.pyplot as plt
from skyborn.plot import curly_vector

fig = plt.figure(figsize=(12, 6))
ax = plt.axes(projection=ccrs.Robinson(central_longitude=180))

curly_vector(
    ds,
    x="longitude",
    y="latitude",
    u="u",
    v="v",
    ax=ax,
    transform=ccrs.PlateCarree(),
    density=0.9,
    color="black",
    arrowstyle="->",
    linewidth=1.2,
    arrowsize=1.2,
    zorder=3,
    integration_direction='both',
    ref_magnitude=30.0,
    ref_length=0.1,
)
ax.coastlines()
ax.set_global()The Skyborn windspharm submodule delivers ~25% performance improvement over standard implementations through modernized Fortran code and optimized algorithms:
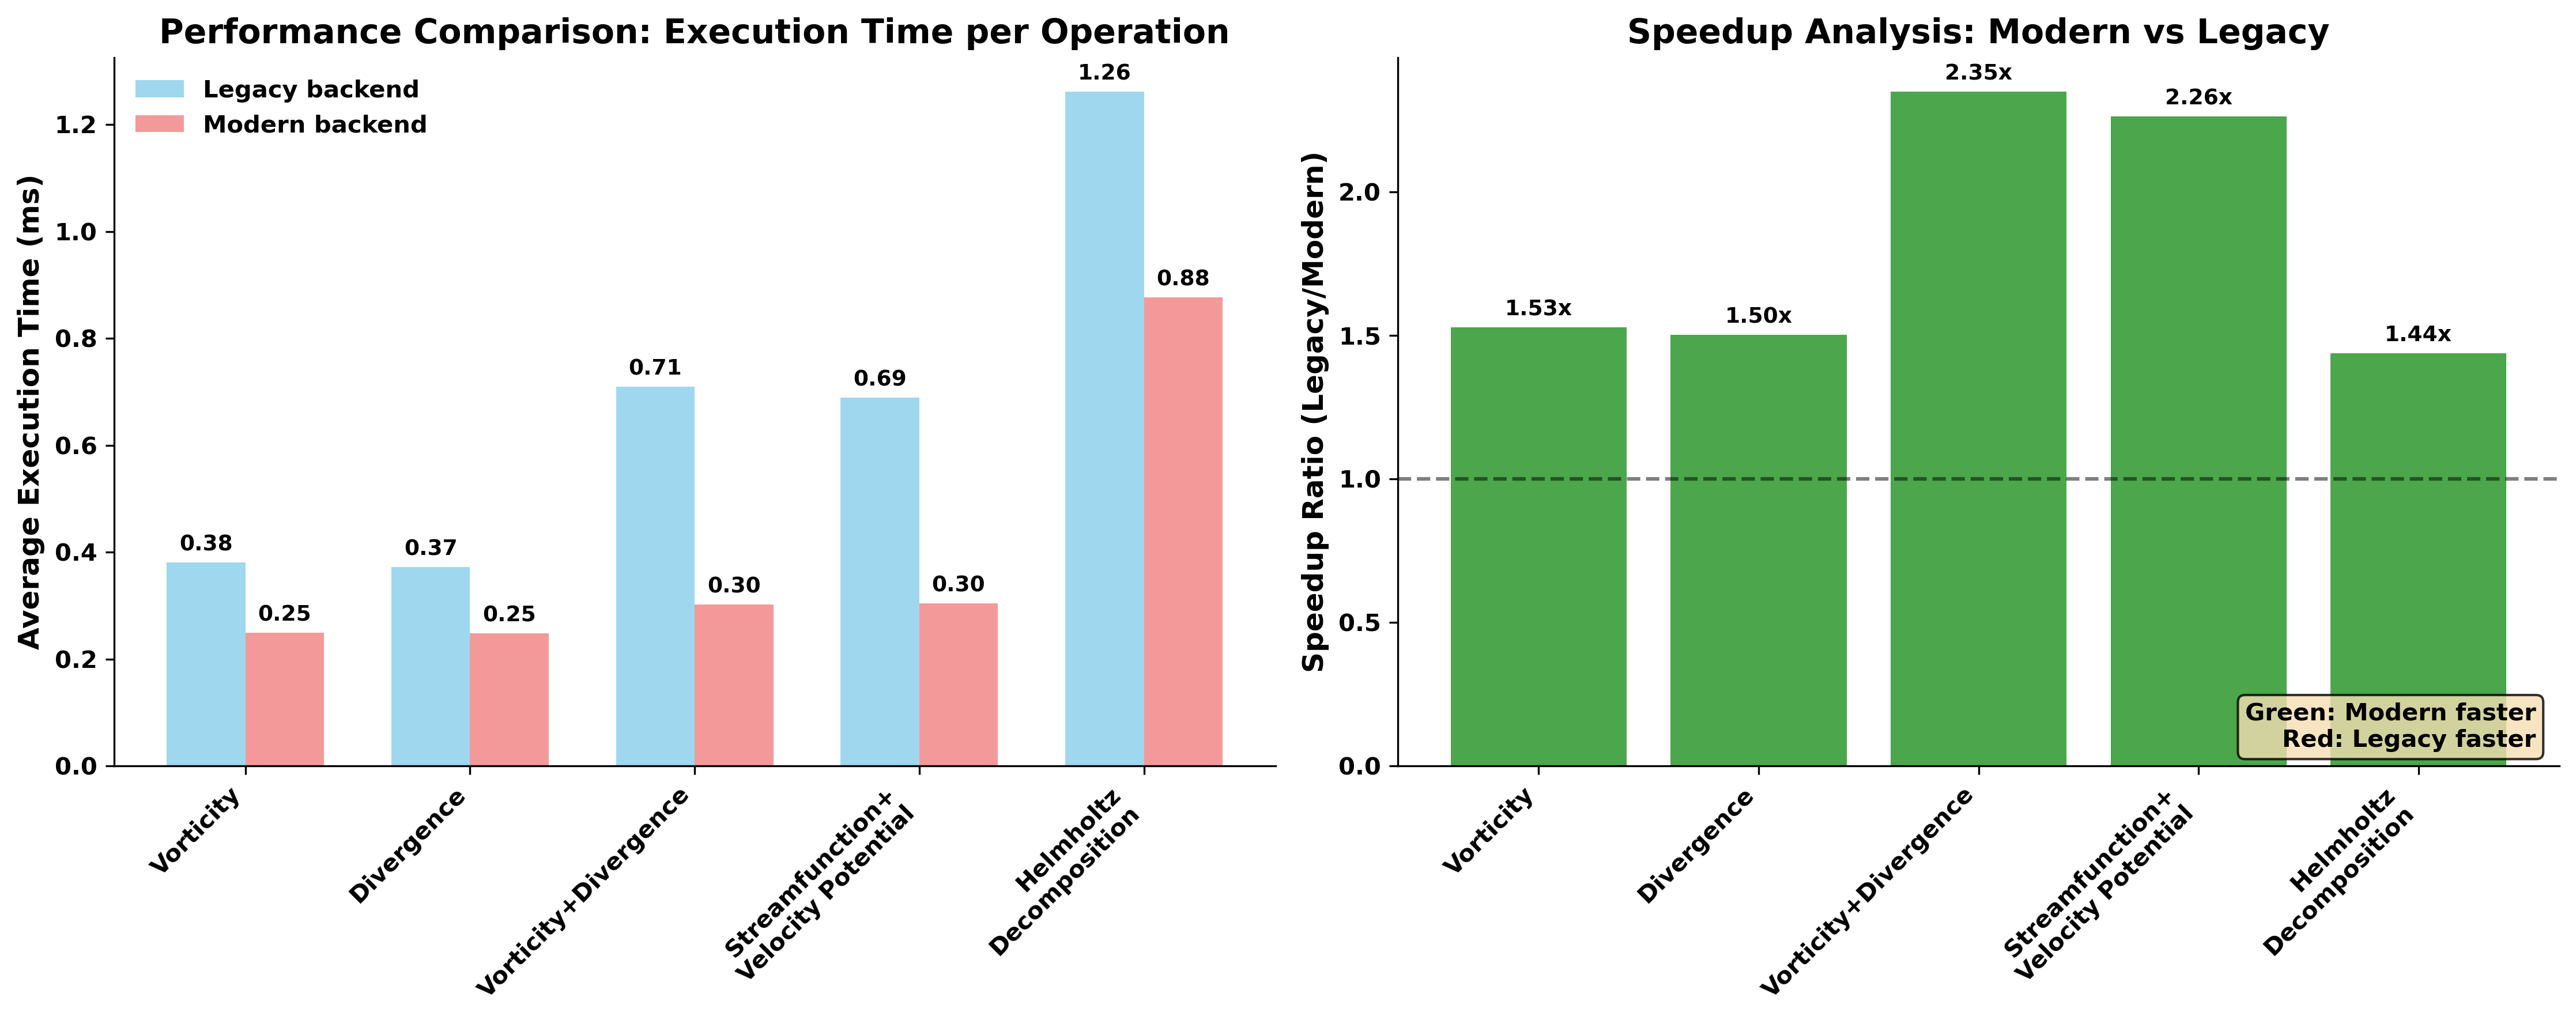
Key Performance Metrics:
- Vorticity Calculation: ~25% faster
- Divergence Calculation: ~25% faster
- Helmholtz Decomposition: ~25% faster
- Streamfunction/Velocity Potential: ~25% faster
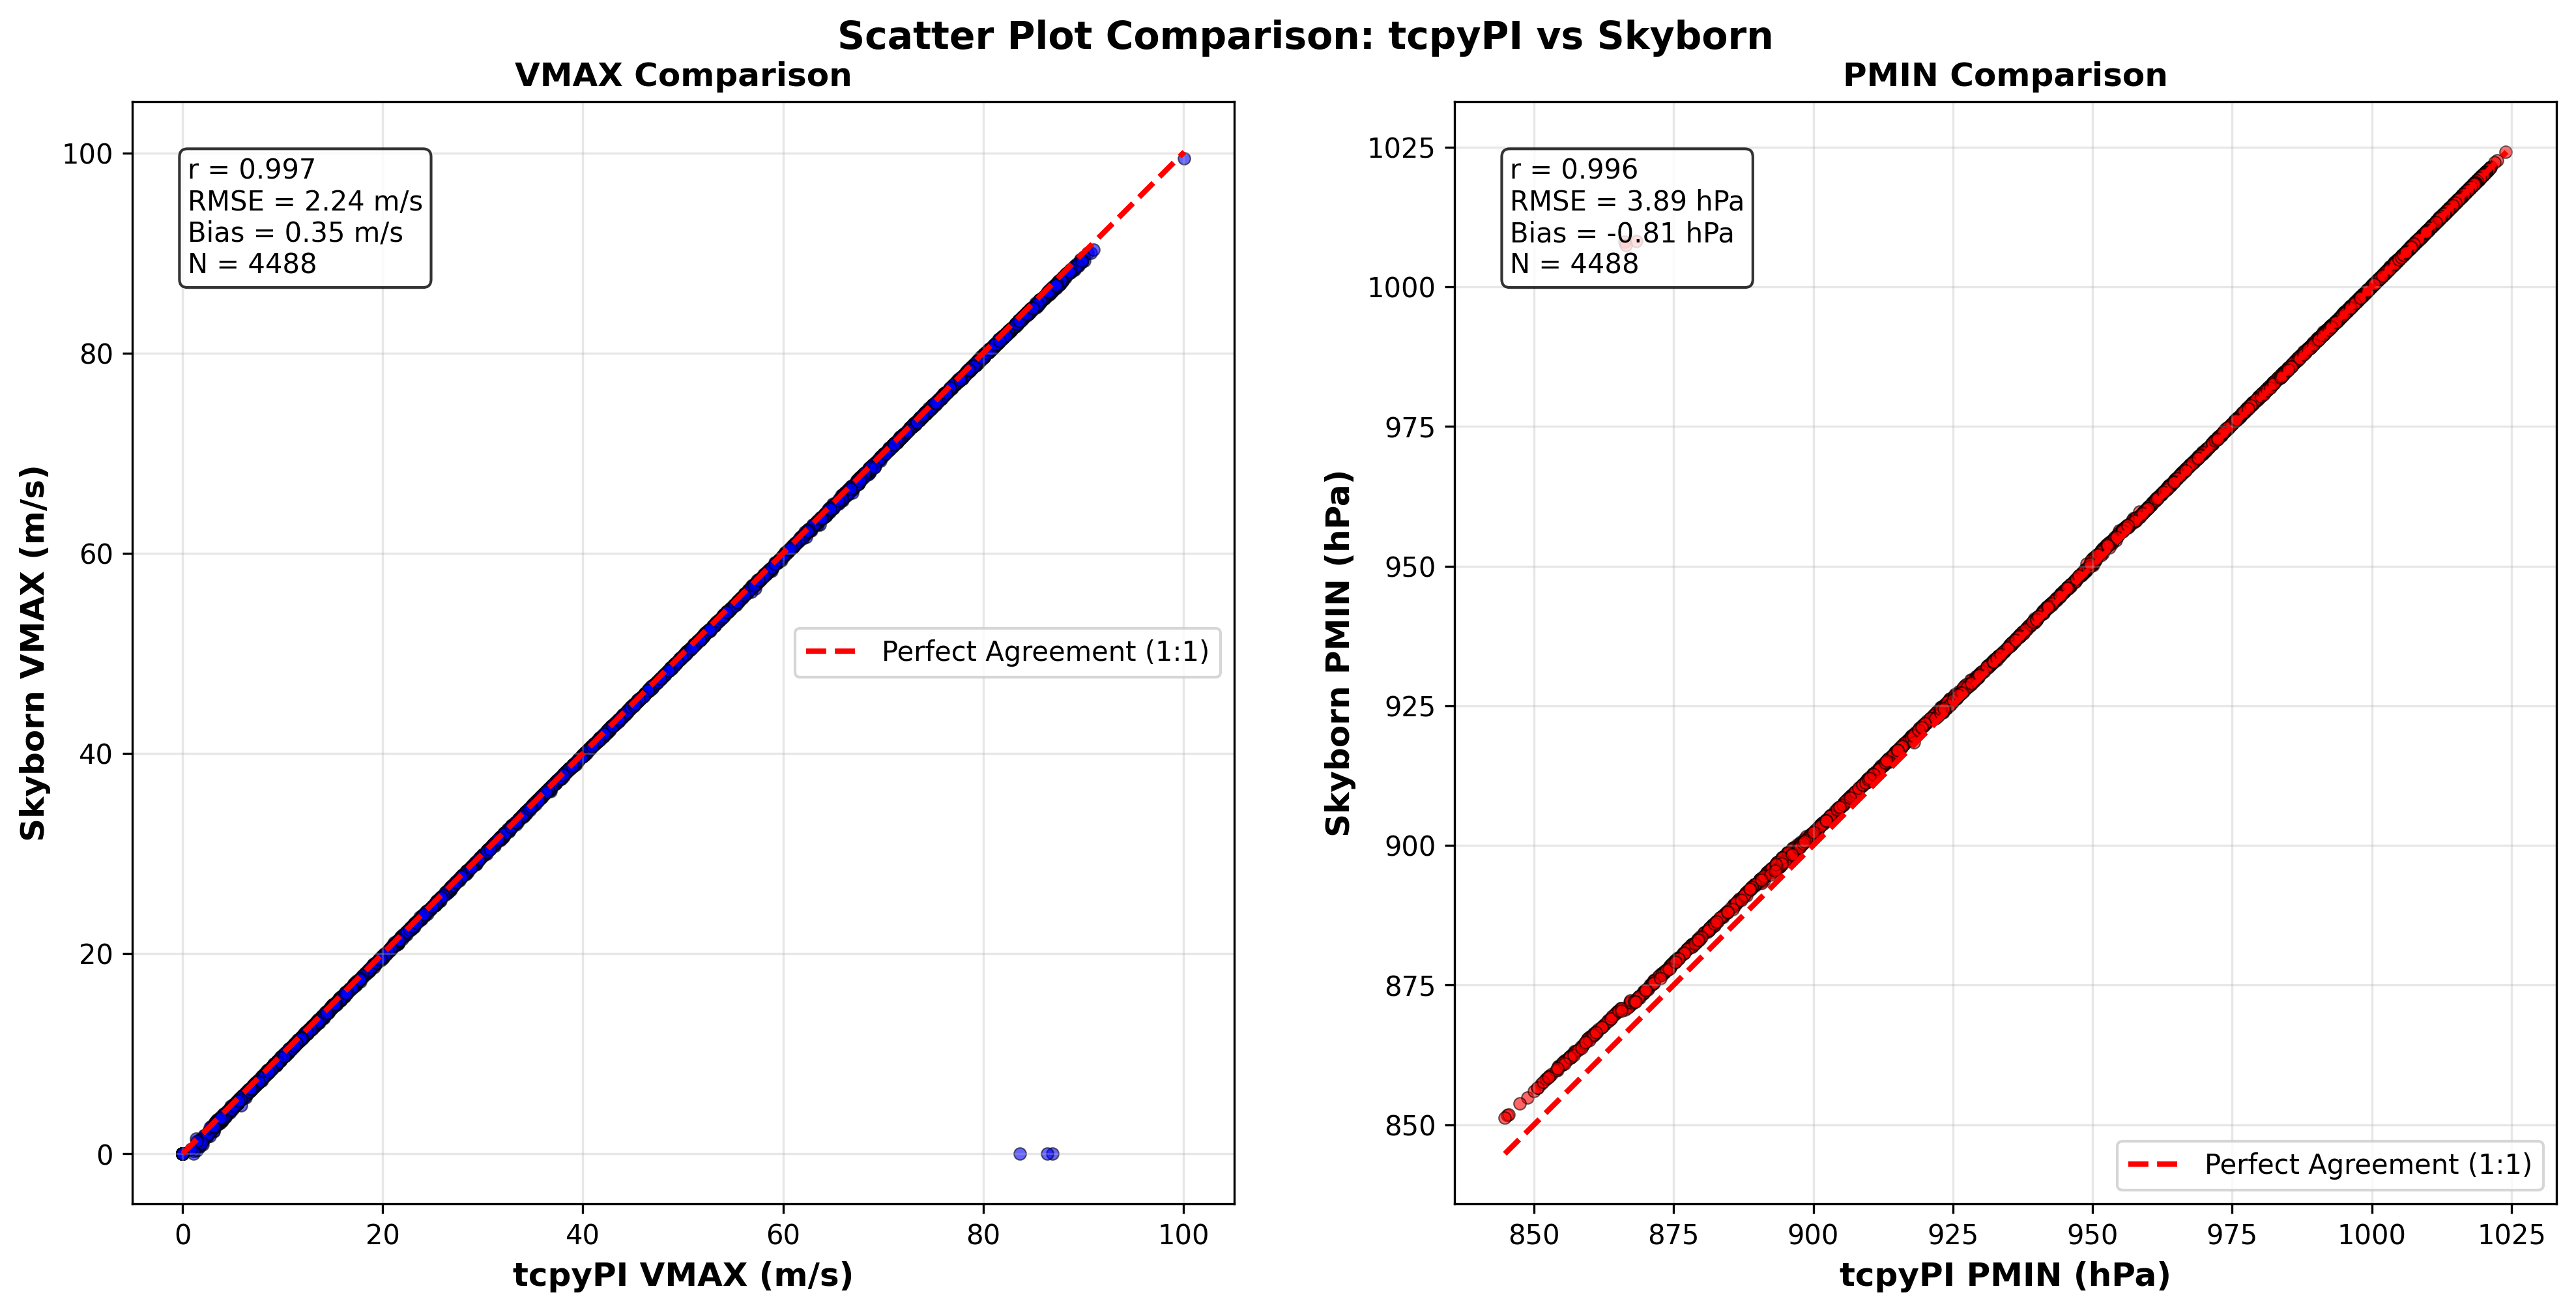
The Genesis Potential Index (GPI) module achieves dramatic speedups through vectorized Fortran implementation and native 3D processing:
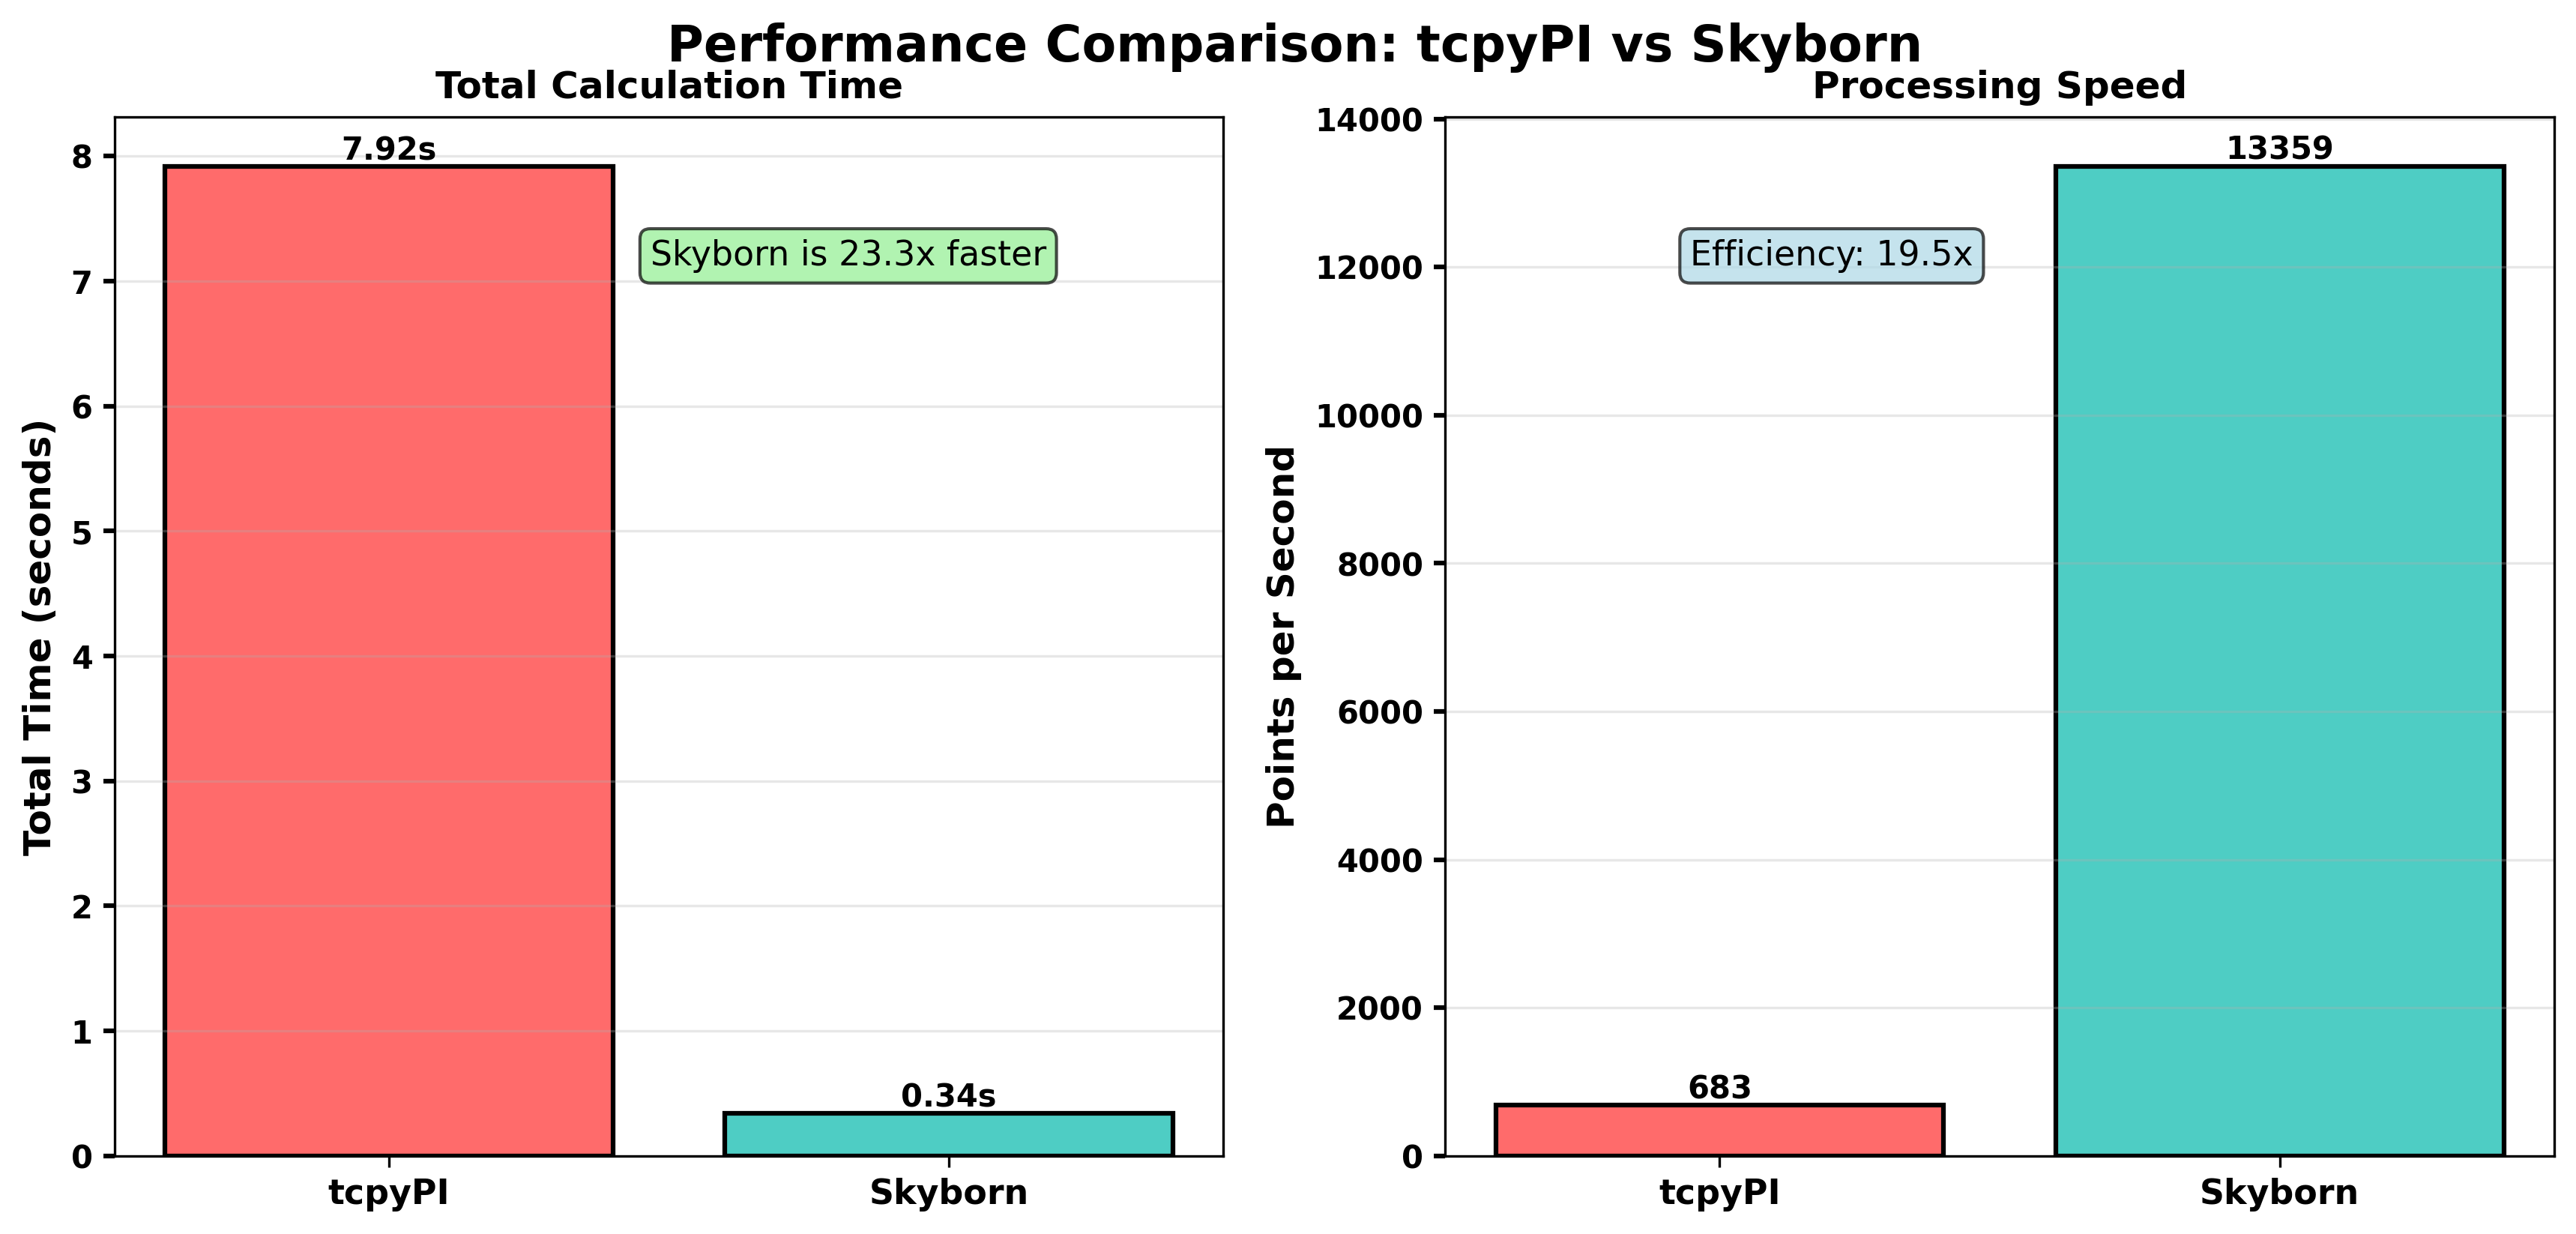
Performance Highlights:
- 19-25x faster than point-by-point implementations
- Processes entire atmospheric grids in seconds
- Native multi-dimensional support (3D/4D data)
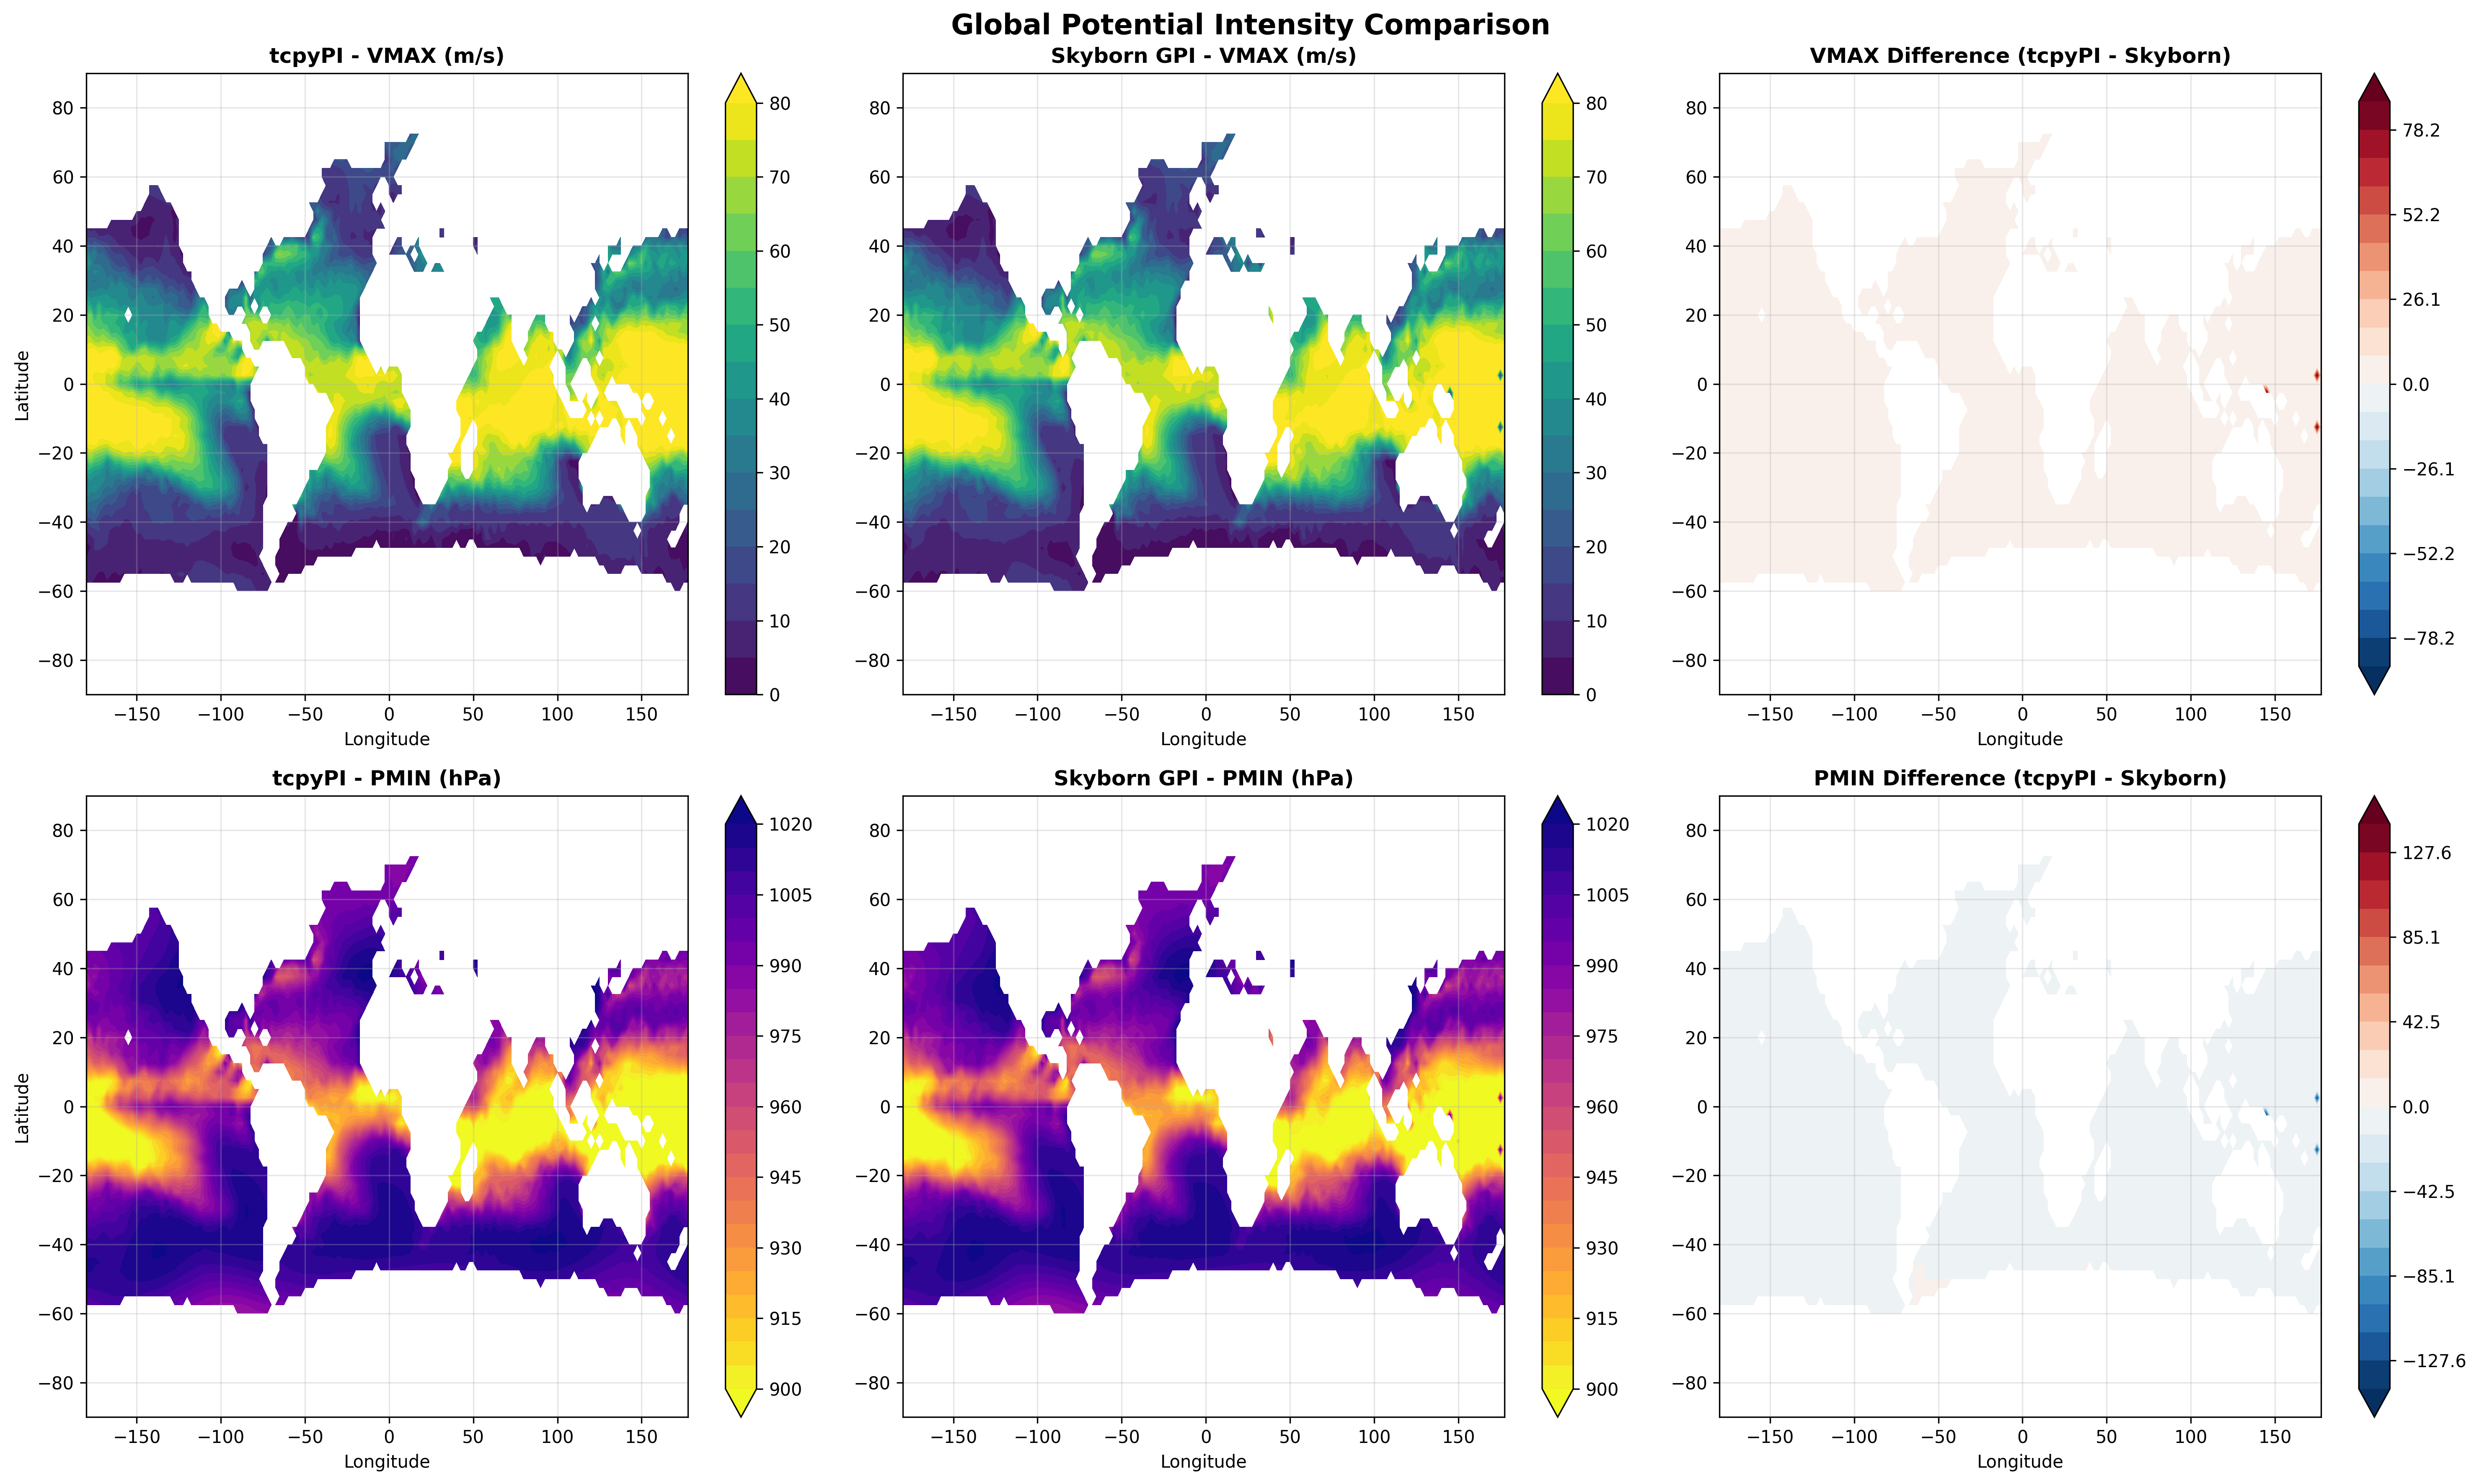
Accuracy Validation:
- Correlation coefficient > 0.99 with reference implementations
- RMSE < 1% for both VMAX and PMIN calculations
If you use Skyborn in your research, please cite it using the following format:
@software{su2025skyborn,
  author = {Su, Qianye},
  title = {Skyborn: Climate Data Analysis Toolkit},
  year = {2025},
  doi = {10.5281/zenodo.18075252},
  url = {https://doi.org/10.5281/zenodo.18075252}
}
Or in text:
Su, Q. (2025). Skyborn: Climate Data Analysis Toolkit. Zenodo. https://doi.org/10.5281/zenodo.18075252