Feature: Kubernetes: Basic Dashboard
Basic dashboard to provide entry level overview of Kubernetes cluster.
- This is the first page the user sees when interacting with Kubernetes.
- Goal: Avoid overwhelming the user from the get go.
- Scope: Show the externally relevant parts of the cluster. The rest is implementation details, separate feature.
- Services
- Nodes
- Scope: Limit the dashboard to answering basic questions:
- "What is running on my cluster?" (ie: services)
- "What is my cluster running on?" (ie: nodes)
- "What has gone wrong on my cluster?"
- Scope: Although graphs will eventually be present on the dashboard, implementing them will be a separate feature.
- Trello: https://trello.com/c/MLjbwBVU/125-kubernetes-cluster-dashboard
Phillip J. Fry leads a small IT at a moderately sized firm. His company has a modest data center.
Phillip is running the 'Poppler.io' application. 'Poppler.io' is an application that runs on top of a Kubernetes cluster. This morning the application stopped "working". Phillip uses the dashboard to diagnose the issue.
Hermes Conrad is the VP of engineering at a large corporation.
Hermes is exploring Kubernetes as a way to orchestrate containers. He has just setup a Kubernetes master, and add further machines. Hermes has no deep knowledge of Kubernetes, but Docker was seemed easy to discover hands-on, and wants to do the same here. Hermes uses the dashboard to see which services are running, where they are running, and start exploring the cluster.
Phillip:
- Opens the Kubernetes dashboard in Cockpit
- Sees list of Kubernetes services running on cluster
- One of the services has a failure icon.
- He hovers over the row in question, and sees that it's running on 2 nodes.
- One of those nodes has a failure as well.
- He discovers a out of disk space issue on the node.
Hermes:
- Opens the Kubernetes dashboard in Cockpit
- Sees list of Kubernetes services running on cluster
- Clicks on a service to explore its details.
- Is taken to browse view (separate feature).
Hermes:
- After deploying a new application (separate feature) ..
- Hermes sees the services with a 'Starting up' indicator ... and they remain in this state until they are ready for use.
- Hermes wants to test one of his frontends, and can just click on the address assigned to the service, to bring it up in a new window of the browser.
More details:
- Dashboard is first thing seen on the cluster
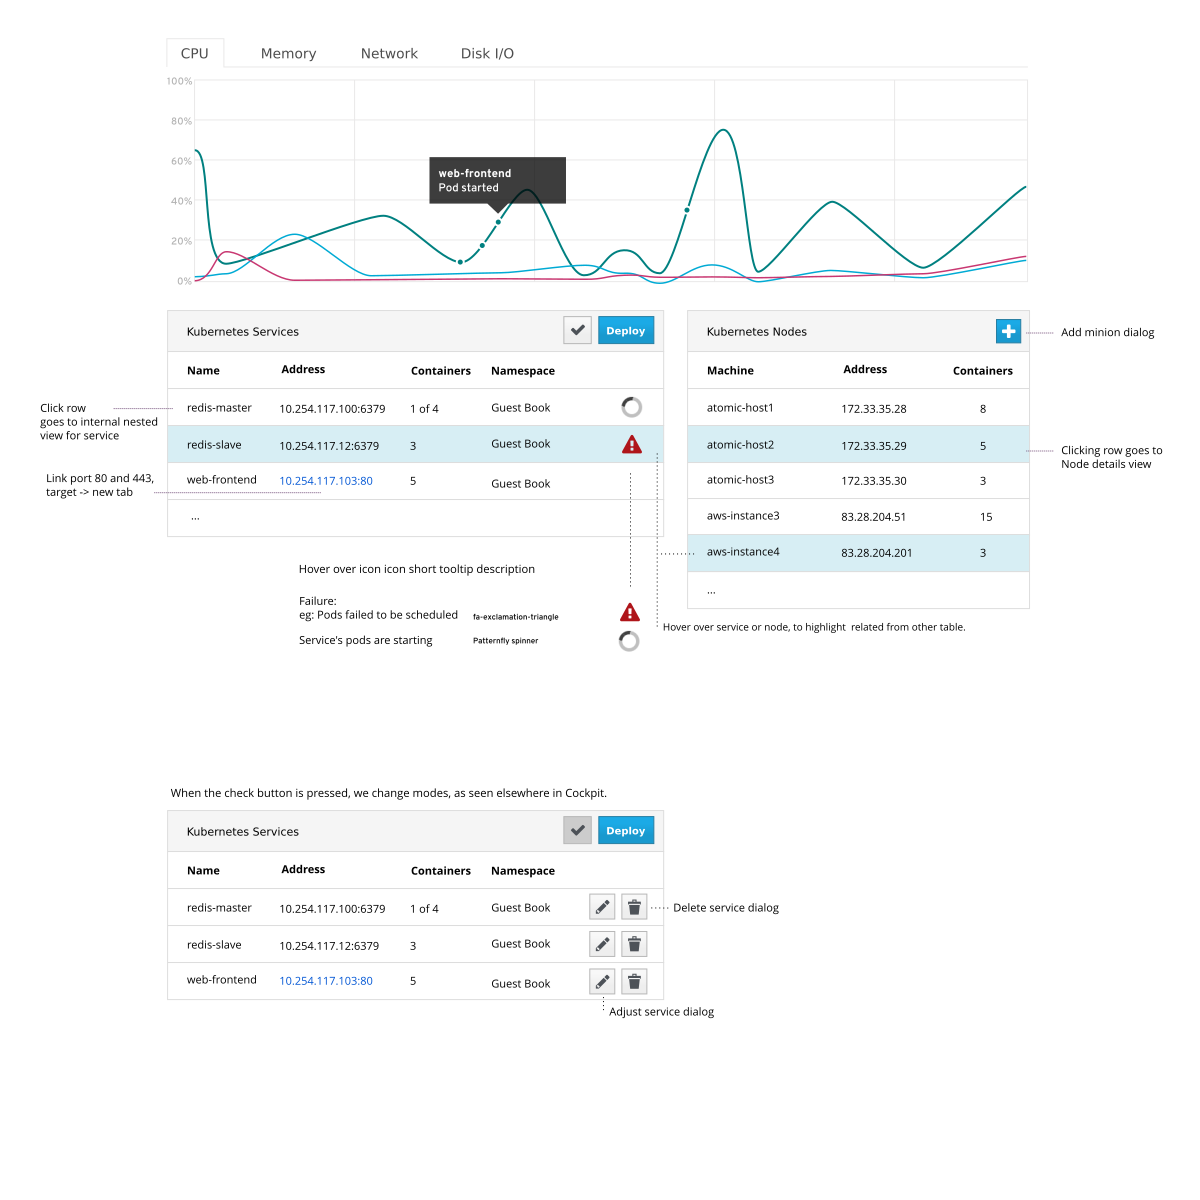
- List is of services is available
- Service info: Service name, Network endpoint, Namespace/Project, # of Containers, Summary of state
- List of nodes in the cluster
- Node info: Host name, # of containers running, Summary of state
- Clicking on service takes you to more detailed 'internal view' info about the service (separate feature)
- Clicking on a node takes you to detailed node info
- Hovering over the state summary shows more details
- User can click bring up 'Deploy application' UI (separate feature)
- User can click bring up 'Add new node' UI (separate feature)
Other dashboard related workflows that start on the dashboard:
- https://github.com/cockpit-project/cockpit/wiki/Feature:-Kubernetes:-Deploy-application
- https://github.com/cockpit-project/cockpit/wiki/Feature:-Kubernetes:-Add-cluster-node
- Watch for changes in kubernetes and update them on the fly.
- Out of scope: Resource Graphs, later work
- Any failed entity related to a service (eg: pod) makes the service appear in a failed state.
- Show scaling information, whether a
- Assumption, definitions for applications are available.
- Currently this is a JSON 'Items' format containing all the services and replication controllers involved.
- Out of scope: Browsing for applications or searching for names in a registry. Later work.
- Make links for services on port 80 and 443, assume they're web accessible in some form.
- Research incomplete
- Pod States
- Pending : means the pod has been accepted by the system, but one or more of the containers has not been started. This includes time before being bound to a node, as well as time spent pulling images onto the host.
- Running : means the pod has been bound to a node and all of the containers have been started.At least one container is still running or is in the process of being restarted.
- Succeeded : means that all containers in the pod have voluntarily terminated with a container exit code of 0, and the system is not going to restart any of these containers.
- Failed : means that all containers in the pod have terminated, and at least one container has terminated in a failure (exited with a non-zero exit code or was stopped by the system).
- Unknown : means that for some reason the state of the pod could not be obtained, typically due to an error in communicating with the host of the pod.
- Calculating number of containers in service listing.
- 'x of y' collapses to x if both identical
- Each of the pod states contributes the number of containers in pod to x or y as noted:
- Pending: y
- Running: x and y
- Succeeded: neither
- Failed: y
- Unknown: y
- For now number of containers in nodes listing, just running containers.
- Failed icon for node if node is completely down (health check failed).
- Icon implementation details:
- Designs, HTML, Wireframes here: https://github.com/cockpit-project/cockpit-design/tree/master/kubernetes
Please give feedback on the above! This is the place where those not working on the feature can provide insight, questions, limitations, notes etc.
- Some design feedback happened here: https://github.com/cockpit-project/cockpit/issues/1687
- Remove scale up and scale down icons, just use spinner, as with starting (Stef, Subin, Jeff)
- We don't need to display '5 of 3' for scaling down (Jeff)
- Very rarely in this state, short period.
- Simplifies things
- ... (sign name)
- ... (sign name)