Expected behavior
Ability to select theme of ggplot using ggtheme() argument in ggsurvplot() function.
Actual behavior
No theme change with input.
Steps to reproduce the problem
# Split this data (explained below)
colon.sex0 <- colon[!(colon$sex %in% 1), ]
colon.sex1 <- colon[!(colon$sex %in% 0), ]
# Create Kaplan-Maier and Cox Proportional Hazard estimate where sex = 0
sex0.kaplan <- survfit(Surv(time, status) ~ sex, data = colon.sex0)
sex0.cox <- survfit(coxph(Surv(time, status) ~ sex, data = colon.sex0))
# Make a list for comparison
sex0.fits <- list(Kaplan = sex0.kaplan, Cox = sex0.cox)
# Same, but where sex = 1
sex1.kaplan <- survfit(Surv(time, status) ~ sex, data = colon.sex1)
sex1.cox <- survfit(coxph(Surv(time, status) ~ sex, data = colon.sex1))
# Make a list for comparison
sex1.fits <- list(Kaplan = sex1.kaplan, Cox = sex1.cox)
# Compare all
all.fits <- list(Kaplan.0 = sex0.kaplan, Cox.0 = sex0.cox, Kaplan.1 = sex1.kaplan, Cox.1 = sex1.cox)
# Plots
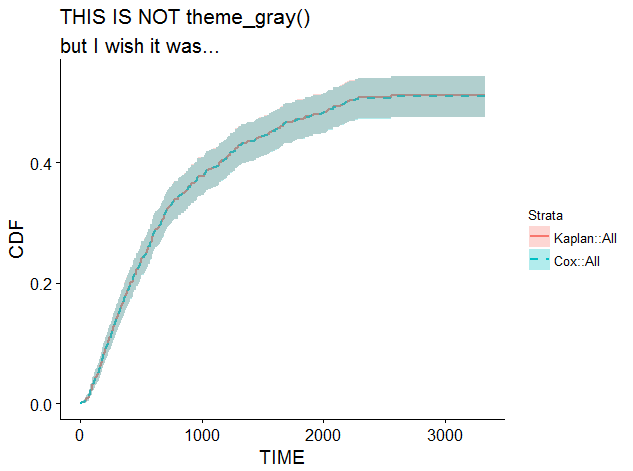
ggsurv.sex0 <- ggsurvplot(sex0.fits, fun = "event", ggtheme = theme_gray(), conf.int = TRUE, legend = "right", combine = TRUE, linetype = c(1, 2), palette = "strata", censor = FALSE)
sex0.plot <- ggsurv.sex0 + ggtitle("THIS IS NOT theme_gray()") + labs(subtitle = "but I wish it was...", x ="TIME", y = "CDF")
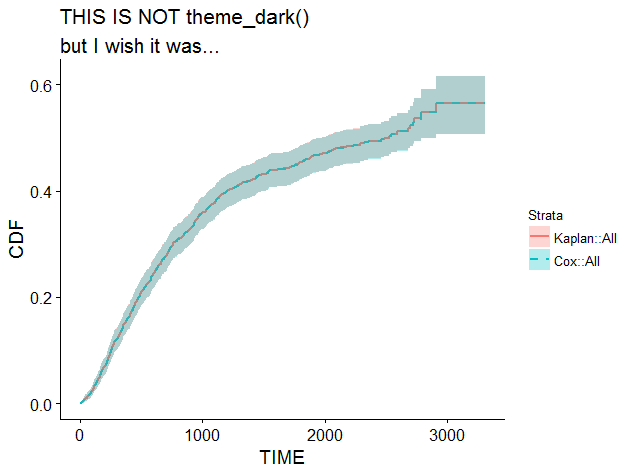
ggsurv.sex1 <- ggsurvplot(sex1.fits, fun = "event", ggtheme = theme_dark(), conf.int = TRUE, legend = "right", combine = TRUE, linetype = c(1, 2), palette = "strata", censor = FALSE)
sex1.plot <- ggsurv.sex1 + ggtitle("THIS IS NOT theme_dark()") + labs(subtitle = "but I wish it was...", x ="TIME", y = "CDF")
ggsurv.all <- ggsurvplot(all.fits, fun = "event", ggtheme = theme_void(), conf.int = TRUE, legend = "right", combine = TRUE, linetype = c(1, 2, 1, 2), palette = "strata", censor = FALSE)
all.plot <- ggsurv.all + ggtitle("THIS IS NOT theme_void()") + labs(subtitle = "but I wish it was...", x ="TIME", y = "CDF")
| Should Be theme_gray |
Should Be theme_dark |
Should Be theme_void |
 |
 |
 |
The reason I separate the colon data is because when I run
# Again, create Kaplan-Maier and Cox Proportional Hazard estimates but using all data
kaplan.sex <- survfit(Surv(time, status) ~ sex, data = colon)
cox.sex <- survfit(coxph(Surv(time, status) ~ sex, data = colon))

# Make list for comparison
fits.sex <- list(sex.km = kaplan.sex, sex.cox = cox.sex)
It creates an undesired result of creating cox estimate for all the data (when I would like to see separate estimates).
# Plot
ggsurv.sex <- ggsurvplot(fits.sex, colon, fun = "event", conf.int = TRUE, legend = "right", palette = c("jco"), combine = TRUE, linetype = c(1,2,3))
sex.plot <- ggsurv.sex + ggtitle("THIS IS NOT WHAT I WANTED") + labs(subtitle = "but I wish it was...", x ="TIME", y = "CDF")
| Undesired Output |
 |
Awesome package by the way =D
-jim
session_info()
R version 3.4.0 (2017-04-21)
Platform: x86_64-w64-mingw32/x64 (64-bit)
Running under: Windows >= 8 x64 (build 9200)

Matrix products: default

locale:
[1] LC_COLLATE=English_United States.1252  LC_CTYPE=English_United States.1252
[3] LC_MONETARY=English_United States.1252 LC_NUMERIC=C
[5] LC_TIME=English_United States.1252

attached base packages:
[1] splines   grid      stats     graphics  grDevices utils     datasets
[8] methods   base

other attached packages:
 [1] bindrcpp_0.1         bshazard_1.0         Epi_2.19
 [4] survPresmooth_1.1-10 MASS_7.3-47          scales_0.4.1
 [7] stringr_1.2.0        taRifx_1.0.6         RCurl_1.95-4.8
[10] bitops_1.0-6         XML_3.98-1.9         gridExtra_2.2.1
[13] data.table_1.10.4    survminer_0.4.0      survMisc_0.5.4
[16] survival_2.41-3      ggpubr_0.1.4         magrittr_1.5
[19] ggplot2_2.2.1        xlsx_0.5.7           xlsxjars_0.6.1
[22] rJava_0.9-8

loaded via a namespace (and not attached):
 [1] zoo_1.8-0         purrr_0.2.2.2     reshape2_1.4.2    etm_0.6-2
 [5] lattice_0.20-35   colorspace_1.3-2  rlang_0.1.1       foreign_0.8-67
 [9] glue_1.1.0        bindr_0.1         plyr_1.8.4        munsell_0.4.3
[13] gtable_0.2.0      ggsci_2.7         psych_1.7.5       labeling_0.3
[17] knitr_1.16        parallel_3.4.0    broom_0.4.2       Rcpp_0.12.11
[21] xtable_1.8-2      cmprsk_2.2-7      km.ci_0.5-2       mnormt_1.5-5
[25] digest_0.6.12     stringi_1.1.5     dplyr_0.7.0       KMsurv_0.1-5
[29] numDeriv_2016.8-1 cowplot_0.7.0     tools_3.4.0       lazyeval_0.2.0
[33] tibble_1.3.3      tidyr_0.6.3       Matrix_1.2-9      assertthat_0.2.0
[37] R6_2.2.2          nlme_3.1-131      compiler_3.4.0
#204
Expected behavior
Ability to select theme of ggplot using ggtheme() argument in ggsurvplot() function.
Actual behavior
No theme change with input.
Steps to reproduce the problem
The reason I separate the colon data is because when I run
It creates an undesired result of creating cox estimate for all the data (when I would like to see separate estimates).
Awesome package by the way =D
-jim
session_info()#204