Hello there, thank you for the awesome work to reach so many wonderful figures via ggplot2. I have an issue when reproducing the 2018-03 figure, producing the following figure:
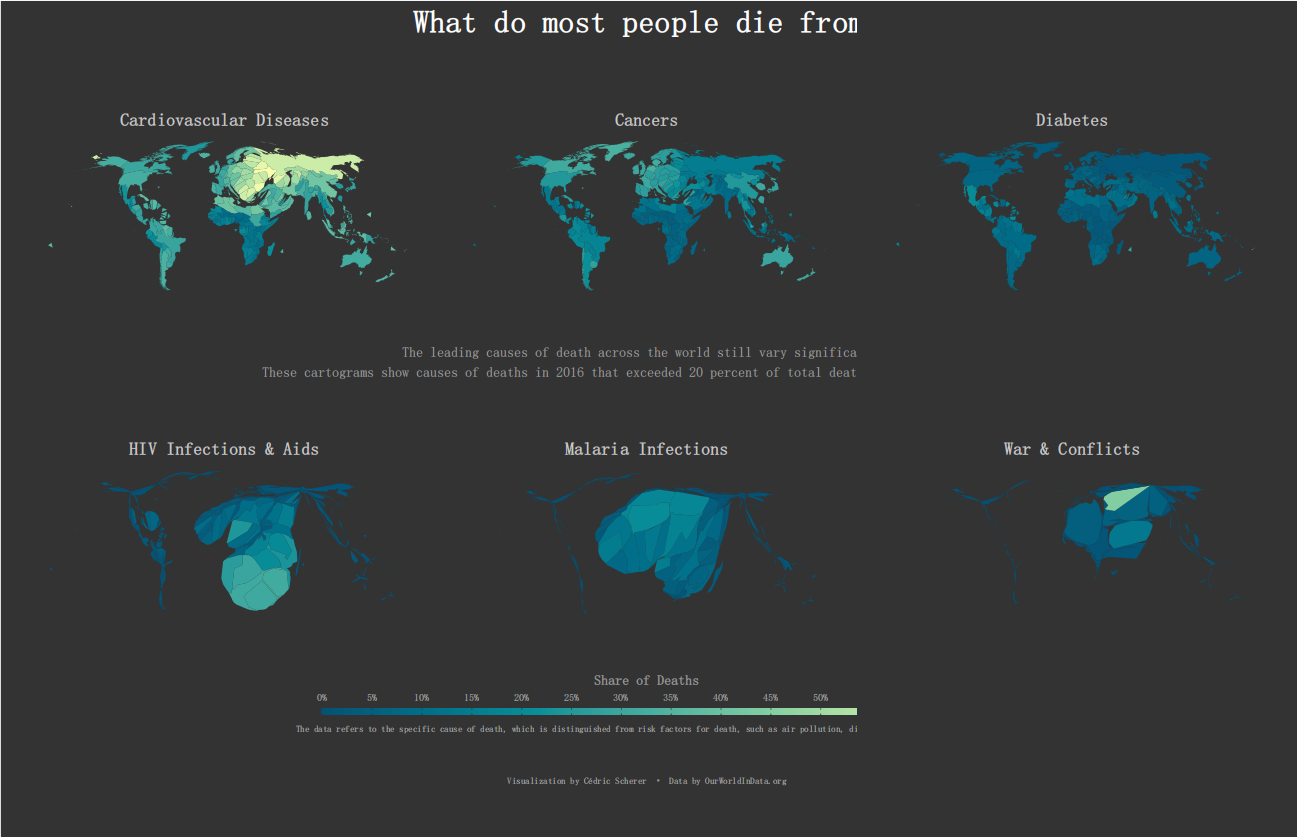
I assume there are two problem occuring here: 1. the 3rd and 6th plot is covering the 2nd and 5th one; 2. fonts could not be loaded automatilcally. Furthermore, because the update of the packages, I find warnings listed as:
old-style crs object detected; please recreate object with a recent sf::st_crs()
Warning messages:
1: It is deprecated to specify `guide = FALSE` to remove a guide. Please use `guide = "none"` instead.
Is there any way to figure them out? Thanks.
Hello there, thank you for the awesome work to reach so many wonderful figures via ggplot2. I have an issue when reproducing the 2018-03 figure, producing the following figure:

I assume there are two problem occuring here: 1. the 3rd and 6th plot is covering the 2nd and 5th one; 2. fonts could not be loaded automatilcally. Furthermore, because the update of the packages, I find warnings listed as:
Is there any way to figure them out? Thanks.